
Apache Tomcat
Apache Tomcat is an open-source implementation of the Java Servlet, JavaServer Pages, Java Expression Language, and WebSocket technologies.
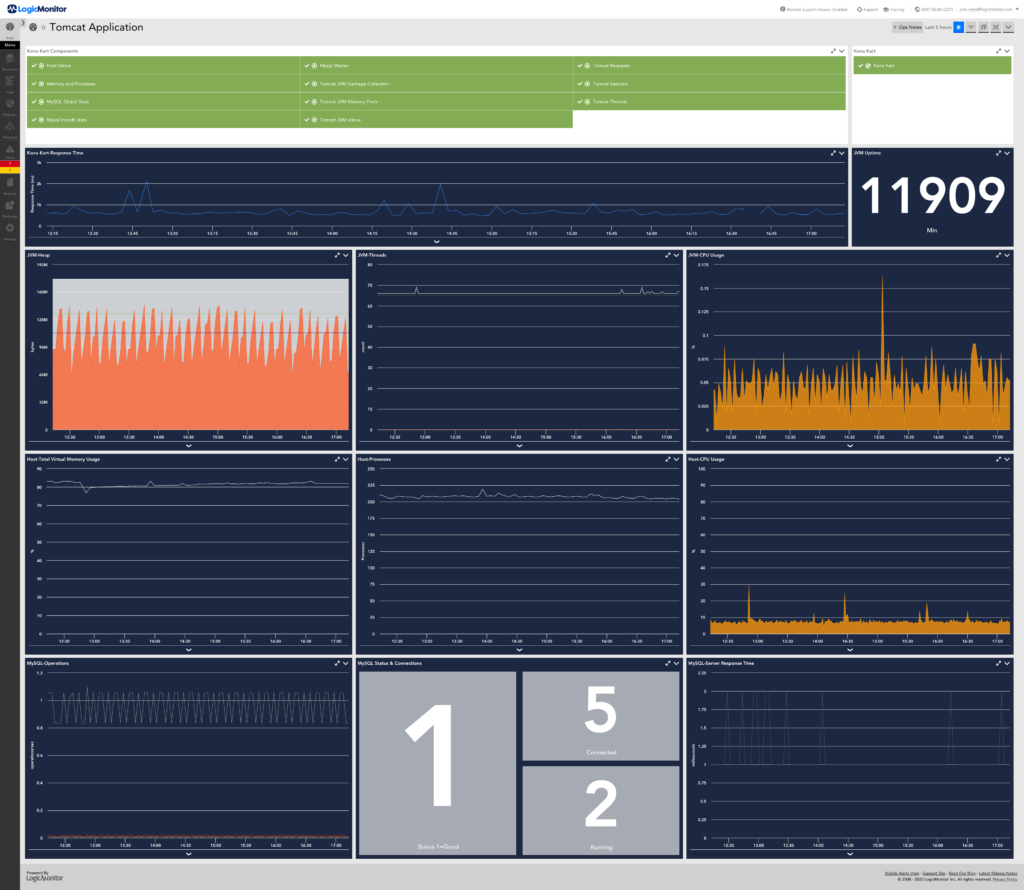
For each Tomcat instance found, LogicMonitor automatically monitors, trends, and alerts on many key performance indicators, allowing you to build out dashboards that show the data critical to your IT Operations. Predefined alert thresholds provide recommendations about settings that may need tuning or indications of Tomcat that may need optimization. Along with the Tomcat data, LogicMonitor provides health visibility of the host, network, and other components that the Tomcat server relies on.
Reduce Gaps in Visibility
LogicMonitor collects Tomcat-related metrics from different protocols, HTTP(S) and JMX, thus providing granular performance visibility of your tomcat instances.
Historic Performance Trends for Forecasting
With LogicMonitor’s Data Forecasting capability, you can easily determine whether your tomcat instances will require more resources before they start showing performance degradation.
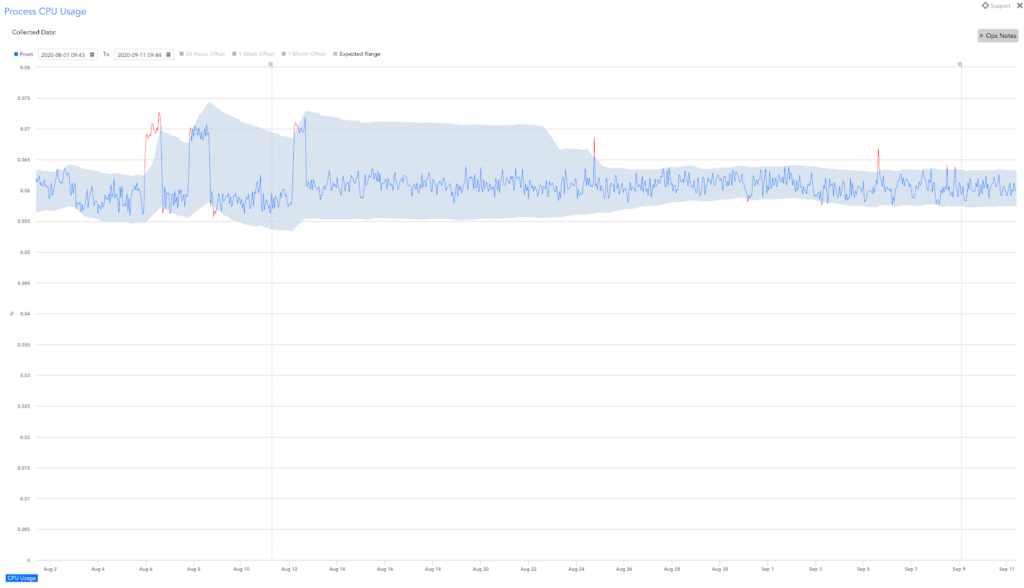
Alerts & Notifications on anomalous behaviour of Key Tomcat Metrics
LogicMonitor uses machine-learning to identify the patterns of key metrics such as cpu & heap utilization, busy threads, error counts, and garbage collection time. With this, LogicMonitor can proactively alert you before your tomcat instances start misbehaving and impact other components.
Setup:
LogicMonitor automatically starts monitoring HTTP(S) endpoints as soon as a device is discovered. For JMX, see the JMX documentation for a list of configuration options usable by all JMX-based monitoring.
Similar & Related Integrations
Apache Web Server
Other Resources
Available LogicModules
Monitors Tomcat cache effectiveness, per Tomcat JMX port and cache path
- Cache Hit Rate
- Cache Hits
Monitor the number of busy and free database connections available to Tomcat, per Tomcat JMX port and data source path
- DB Connections
Monitors thread info from Tomcat Executor instances, per Tomcat JMX port and executor name
- Completed tasks
- Queue Size
- Threads for instance
Monitors Tomcat JVM Garbage collection information
- Garbage Collection executions for instance
- Time spent in instance Garbage Collection
- Time per collection
Monitors memory stats per pool
- Memory Pool Usage per Tomcat JMX port and memory pool name. Can have a threshold set to alert if the amount of Used memory in this pool is too high, but the ‘Tomcat JVM Garbage Collection-‘ data source should deal with this in most cases.
Monitors Tomcat JVM resource usage (CPU, Threads, Heap, Uptime, and other stats), per JMX port
- CPU Usage for this process
- File Descriptors
- Heap
- JVM Uptime
- Threads
Monitors the request rate and throughput, per Tomcat JMX port and request processor name