
ConnectWise
LogicMonitor is the leading SaaS-based monitoring solution and an increasingly popular alternative to premise-based and open-source solutions. Complementary to RMM tools, a growing number of MSPs rely on LogicMonitor to monitor everything in their datacenter, including complex technologies such as VMware, NetAPP, Citrix, Cisco, Juniper, SonicWALL, and more. Rapid, painless implementation, month-to-month billing, a small footprint, and the ability to unify physically and virtually disparate IT infrastructure provides irreplaceable value.
LogicMonitor’s direct integration with ConnectWise gives managed service providers a more streamlined workflow, as well as graphical views into the status of tickets that help managers gain valuable insight about their business.
Service Board Monitoring
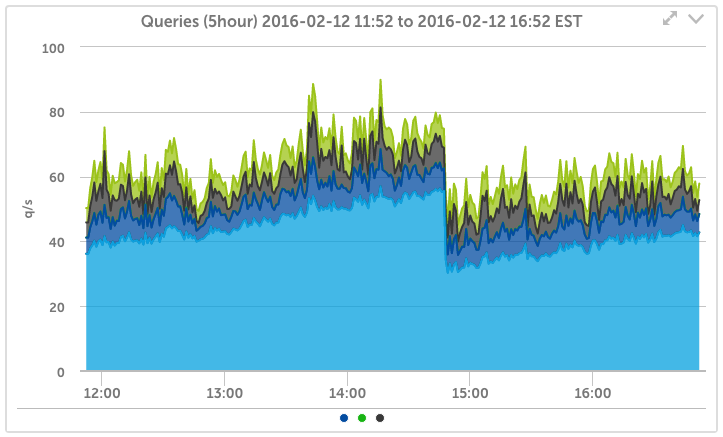
In addition to opening, updating and closing ConnectWise tickets in response to LogicMonitor alerts, LogicMonitor provides the ConnectWise Service Board Depth datasource out-of-the-box, which automatically discovers your Service Boards and graphs the number of open service requests in each, so you can see queue depths trending over time. Set alerts based on the number of open tickets, and easily create additional datasources to monitor ConnectWise metrics such as:
- Number of open tickets per support rep
- Tickets greater than x days old
- Many more


Feature & Benefits
- LogicMonitor alerts automatically open, update and close tickets in the appropriate service board with the appropriate company, classification, and issue type.
- Real-time graphs show total number of open, closed, or pending tickets in each queue.
- Create custom datasources to monitor other aspects of ConnectWise accessible through the ConnectWise API.
- Set up graphs & alerts based on any accessible ConnectWise metrics.
Available LogicModules
Monitors the ConnectWise ticket count per Service Board
- Open Tickets
