

Citrix NetScaler
LogicMonitor’s unique hosted monitoring makes Netscaler monitoring effortless. It will allow you to easily answer questions such as:
- Are your Netscaler HA nodes synchronized in their configurations?
- Is integrated caching running effectively?
- Are all the production VIPs up, and do they all have redundant back-ends?
- Which VIP is the busiest?
- Has traffic on that VIP changed over the last month?
Intelligent alert thresholds will be set, alerting you to any issues in hardware, performance or configuration. All with no configuration on your part.
Just a few of the critical Netscaler metrics we monitor:
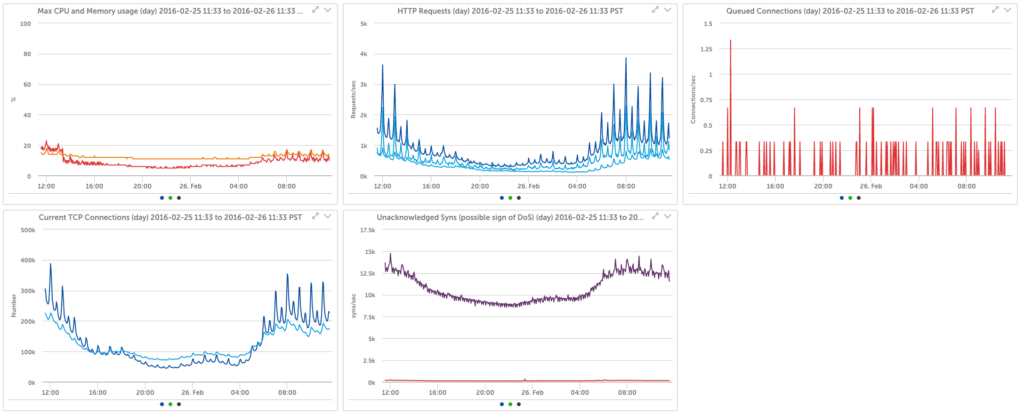
Netscaler Global Statistics
The CPU load of a Netscaler is an important metric to monitor, but LogicMonitor doesn’t stop there. It detects and monitors all the individual CPUs in a multi-processor system, tracks consistency point and interrupt activity, and lets you correlate whether the CPU load is impacting your request latency, or not.
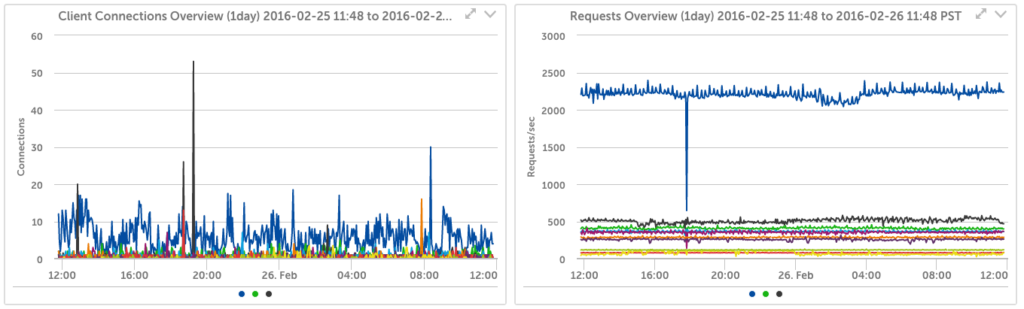
Overview Graphs
Automatically generated overview graphs of requests, connections, and throughput make it easy to isolate performance issues.
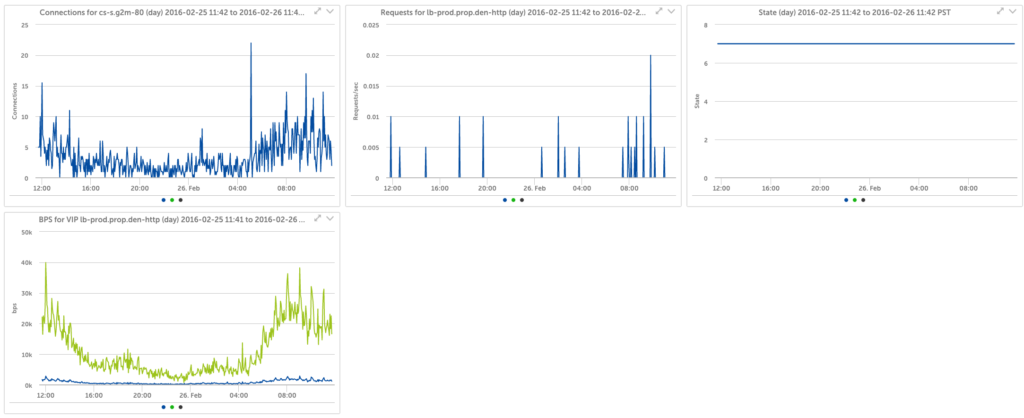
Netscaler VIP Monitoring
Dive into the details of every load balancing and content switching VIP – see traffic, requests, performance and connections for any period from 10 minutes to a year. Be alerted if backed servers are down. All automatically.
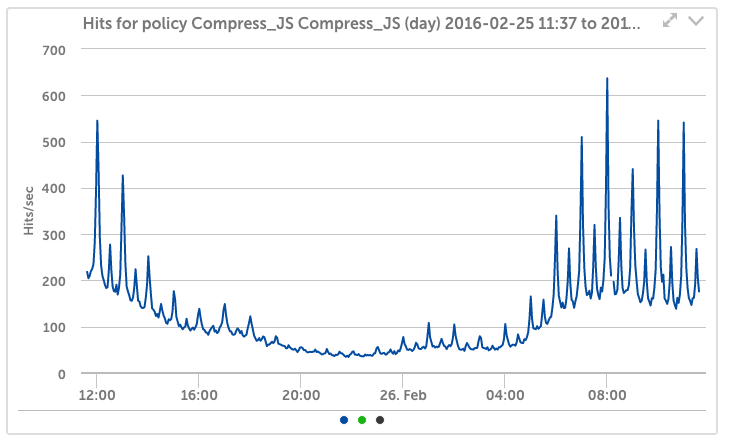
Feature Monitoring
Turning on policies? Compression? Integrated Caching? LogicMonitor will detect it, monitor it, alert you to issues, and trend the performance metrics of the feature – all automatically.
And like all devices monitored by LogicMonitor, the configuration is automatically kept up to date. Eliminate the chance of your customers knowing about outages before you, because a VIP was not added to the monitoring system. Get monitoring that frees up time, and keeps up with your dynamic environment – LogicMonitor.