
SANTA BARBARA, Calif.–(BUSINESS WIRE)–LogicMonitor, the automated end-to-end infrastructure performance monitoring solution, today announced the addition of Executive Dashboards to its SaaS platform. The added functionality provides CIOs and CTOs with an easy-to-consume dashboard of the overall health and performance of their critical IT infrastructure. Technology leaders can immediately and easily view aggregated performance information on critical infrastructure and applications, elevating key performance indicators for wider consumption and decision-making.
“In today’s fast moving operations climate, IT Operations teams can be a real source of strategic advantage over the competition. CIOs are being asked to make massive reductions in time-to-market for new applications, ensure high-availability of web apps, and drive amazing customer experiences,” says Jeff Behl, LogicMonitor’s Chief Network Architect. ‘As someone who runs a high-stakes Technical Operations team, our ability to quickly assess and act on critical performance information is a game-changer. Aggregated performance data allows us to act fast, quickly making choices that help to improve overall infrastructure performance and customer experience.’
Power insights at a glance
Considering LogicMonitor’s already powerful dashboading, trending and alerting capabilities, the addition of Executive Dashboards allows IT teams, including management, to see snapshots of system health (network traffic, application hit count, visitors, etc.) and trends of performance or health (capacity, traffic, load over a day, week, etc.) over time.
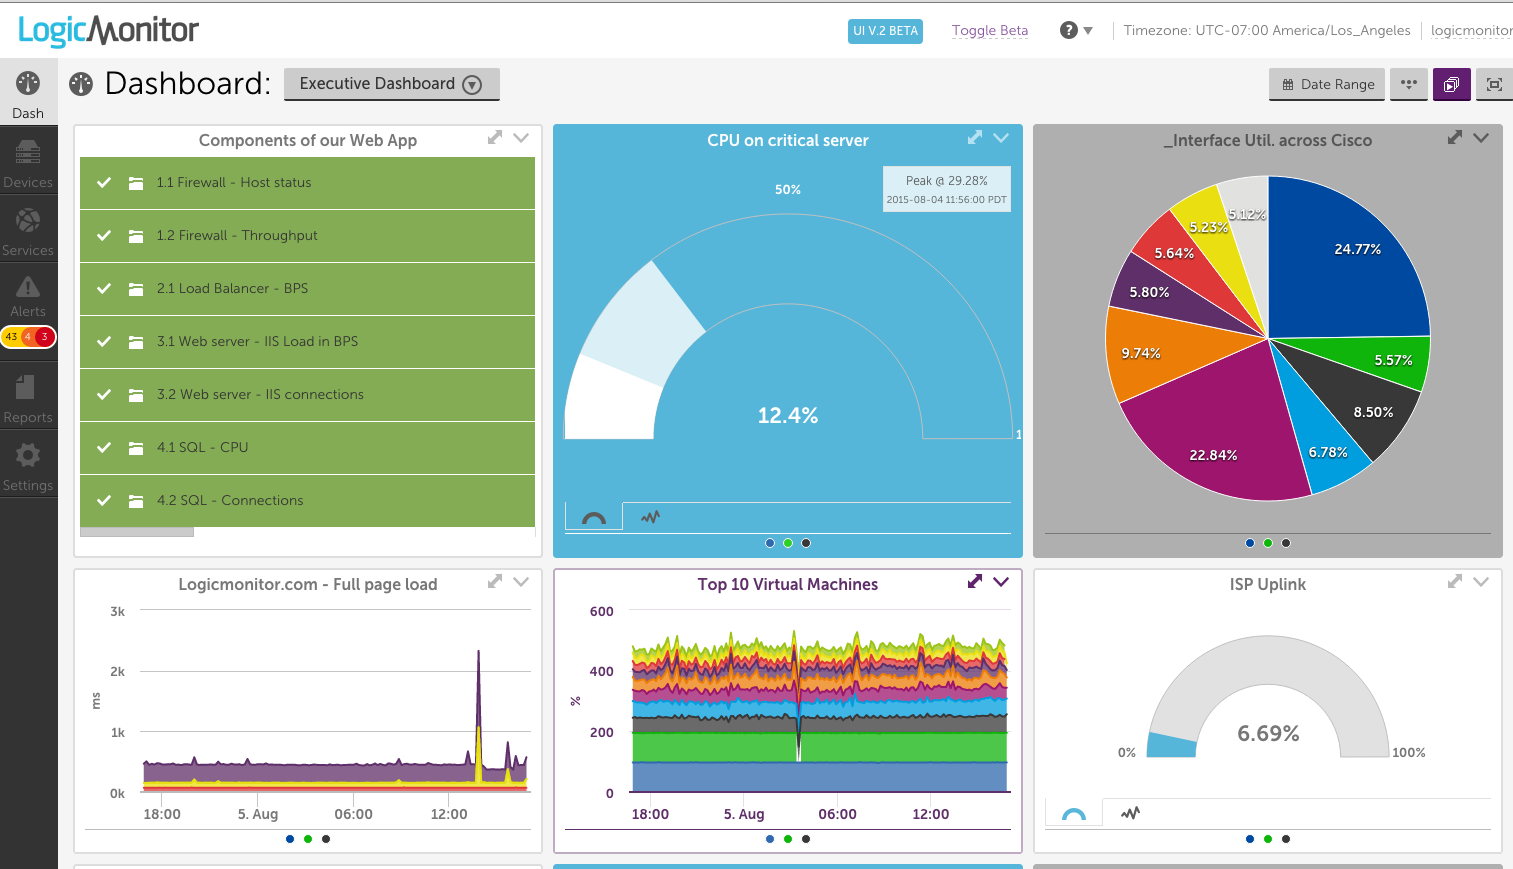
The Executive Dashboard suite consists of new widgets within LogicMonitor, including:
- Gauge widgets to display metrics such as CPU for status in relation to peak
- NOC Overview so teams can easily see the alert status for a group of devices, especially all the devices running one application
- Pie Chart widget for easy viewing of items such as the percent of network used by certain applications
- Big Number widget, used to obviously display metrics such as disk space on a group or number of credit card transactions in real time
Benefit of End-to-End Visibility
“End user application performance has become increasingly important and meanwhile our customers asked us for high level, aggregated performance visuals in LogicMonitor,” said Kevin McGibben, LogicMonitor’s CEO. “Our Executive Dashboards are a first step to satisfy managers’ desire to visualize mission-critical performance metrics. Managers don’t want to rely on performance updates having to surface through their teams to their attention. They want immediate access to relevant performance metrics, whether at the service, application, or datacenter level, so that they can make faster, better decisions to manage their business.”
LogicMonitor is displaying Executive Dashboards in booth 306 at VMWorld in San Francisco from August 30-September 3.
About LogicMonitor
LogicMonitor’s SaaS-based performance monitoring platform that provides the world’s best IT Ops teams with visibility and actionable metrics to manage today’s sophisticated on-premises, hybrid and cloud IT infrastructure. Deploy fast and deliver performance data with built-in and fully-customizable visualization, forecasting, alerting, and reporting analytics. Empower Ops success.