
v.101 Release: Improved Alert Thresholds Report and Expanded Cloud Monitoring
Last updated on 14 September, 2022The v.101 Release will be rolled out through mid-March. Among the changes you will see are an improved Alert Thresholds Report and even more monitoring coverage for your cloud environment.
Alert Thresholds Report
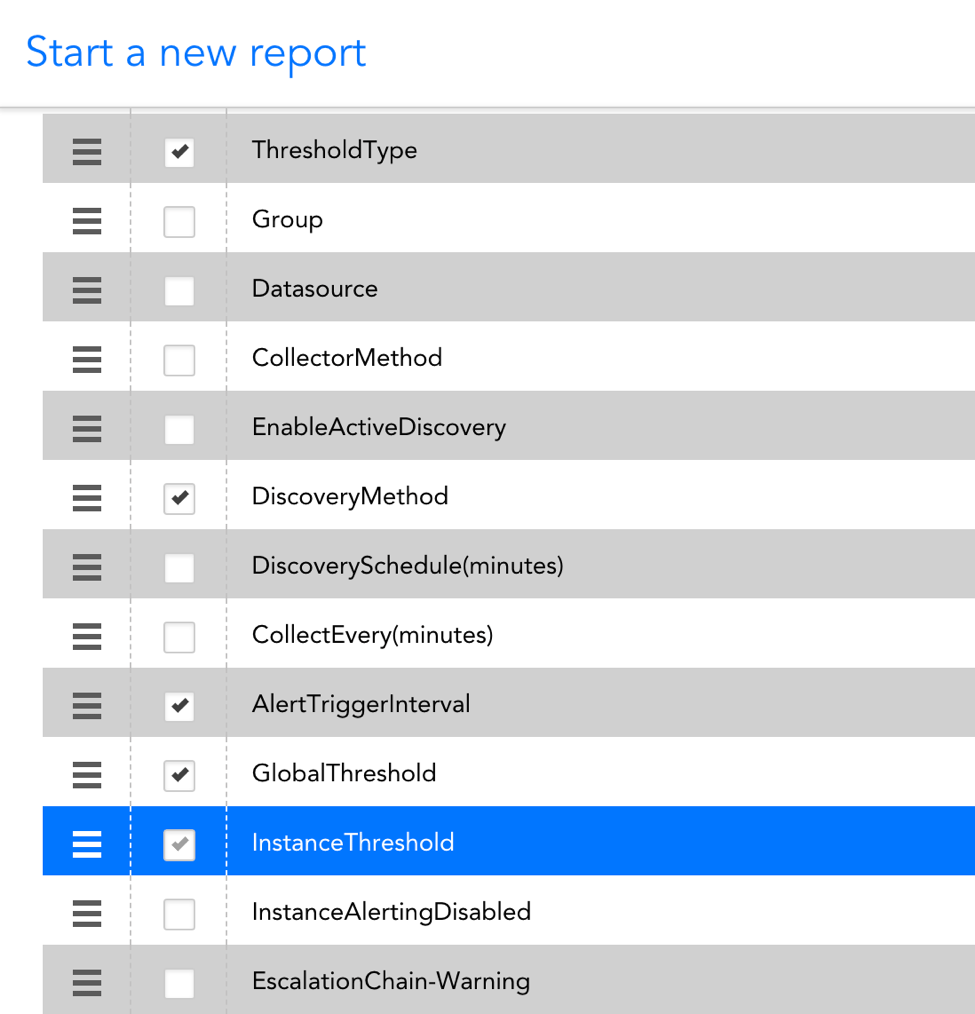
The Alert Thresholds Report provides critical insight regarding when and where LogicMonitor will trigger alerts across your environment. To provide more context for these thresholds, we have added support for the following table columns:
- Group
- DataSource
- CollectorMethod
- EnableActiveDiscovery
- DiscoveryMethod
- DiscoverySchedule(minutes)
- CollectEvery(minutes)
- AlertTriggerInterval
- GlobalThreshold
- InstanceThreshold
- InstanceAlertingDisabled
- EscalationChain-Warning
- EscalationChain-Error
- EscalationChain-Critical
New Cloud Monitoring
We have added new DataSources for the following cloud resources:
- Service Bus resources with non-premium Azure SKUs
- AWS Classic ELB Service Limits
Other Improvements
Collector
- Updated the language in the Collector Size dropdown to be consistent with the sizes on the Add Collector dialog
- Minor changes to the Manage Collector dialog. Moved the ‘Delete’ button to the bottom left corner of the window for consistency with other dialogs
Dashboard
- You can now display up to 400 items on the Map widget at a time. Please note that node animation will be disabled when there are over 100 items.
- Added ability to specify a color for virtual datapoints in the Pie Chart Widget
- The SLA widget can now change colors according to user-defined thresholds
- Combined SDT and alert icons on the NOC Widget to preserve space
- Previously, when configuring the NOC widget, the GroupBy field determined which fields were used to filter the results. For example, for GroupBy=device, only the device field would be evaluated when determining which devices to display, even if a DataSource was selected that only applies to one device. We have improved this so that all fields are considered when filtering the NOC widget, regardless of the GroupBy value
- The Service SLA widget and report will use raw data to more accurately calculate SLA rather than using alert status
Devices
- A maximum of 1000 graphs will be displayed for any given device dashboard. This ensures that UI performance is not compromised in cases where a DataSource has thousands of instances, each with several graphs
LM Cloud
- Added a new parameter to the “AWS EC2 Reserved Instance” AD method that makes instance names configurable. Previously, this method (utilized by the ‘AWS_EC2_Reserved_Instance DataSource) named all discovered instances based on the RI offer ID. Because this ID doesn’t always provide as much meaningful information as the instance type, region, etc. for the RI offer, the new parameter allows you to utilize the following properties, among others, in the name configuration: auto.instancetype, auto.location, auto.offerid
- Properties that are automatically added to cloud devices by LogicMonitor and that have a date / time value are now displayed in epoch format. This is more consistent with date / time properties automatically added to normal devices, and enables use of these properties in Applies To expressions
- Improved the permission test error displayed when an invalid role is specified for a cloud account
- Added AD filtering capabilities to the ‘AWS EC2 Scheduled Events’ AD method. This filtering can be based on instance level properties added for each discovered event. You may find this useful for filtering out events that have been completed, via a filter based on ‘auto.aws.status’
LogicModules
- Fixed an issue in which the Auto-Detect option for EventSource logs were not showing in Chrome
- In some cases, log file encoding is different from our default settings for monitoring them. We have added the ability to manually specify the encoding type (Default, Autodetect, UTF-8, or UTF-16) of log files within EventSources
- PowerShell scripts are now supported in PropertySources
REST API
- A REST API equivalent has been published for the RPC method ‘getGraphImage’. More info here
- Published the ability to get DataSource history information programmatically
Bugs Fixed
- In some cases, tags weren’t being populated correctly for Azure VMs. This has been corrected
- Resolved an issue with uploading custom portal logos that resulted in malformed images
LogicModule Releases
Below is a list of improved LogicModules that were implemented since our last release:
New Monitoring Coverage
- AWS_EC2_TrustedAdvisorServiceLimits – 1 DataSource
- Ciena WaveServer – 13 DataSources, 1 SNMP SysOID Map
- Tegile Intelliflash – 8 DataSources, 1 SysOID Map, 1 PropertySource
- AWS Classic Elastic Load Balancer Service Limits – 1 Datasource
Monitoring Improvements
- Microsoft Azure SQL Databases – 1 DataSource
- Added deadlock monitoring
- AWS ElastiCache Redis, AWS ElastiCache Memcached, AWS_Kinesis_Firehose, AWS_Kinesis
- Increased polling interval to 2 minutes to reduce CloudWatch costs
- AWS Lambda – 1 DataSource
- Fixed CDPs to return 0 if no data
- Cisco_IOS ConfigSource – 1 ConfigSource
- Improved error handling around the connection process
- Resolved issue where privilege escalation would fail, causing the script to fail entirely
- Cisco_NXOS ConfigSource – 1 ConfigSource
- Improved error handling around the connection process
- Fixed logic issue when attempting to match prompt
- Fortinet_FortiOS ConfigSource – 1 ConfigSource
- Improved logging
- Improved script logic
- Azure VM’s – 1 DataSource
- Fixed valid value range which was causing data collection issues
- APC Integrated Environment Monitor Probes – 1 Datasource
- Updated descriptions and graphs to modern standards
- Added a delta based warning for probes with no thresholds set
- Microsoft Azure Web Application – 1 DataSource
- Fixed various faulty datapoints
- Juniper JUNOS ConfigSource – 1 ConfigSource
- Better logging for debug
- Fixed issue in which the ConfigSource wouldn’t know how to respond to pre-operational mode environments and fail