
v.105 Release: Azure Status Monitoring and Auto-Filled Alert Thresholds
Last updated on 24 August, 2022The v.105 Release will be rolled out through the end of May and first week of June. Among the improvements you will see are:
Azure Status Monitoring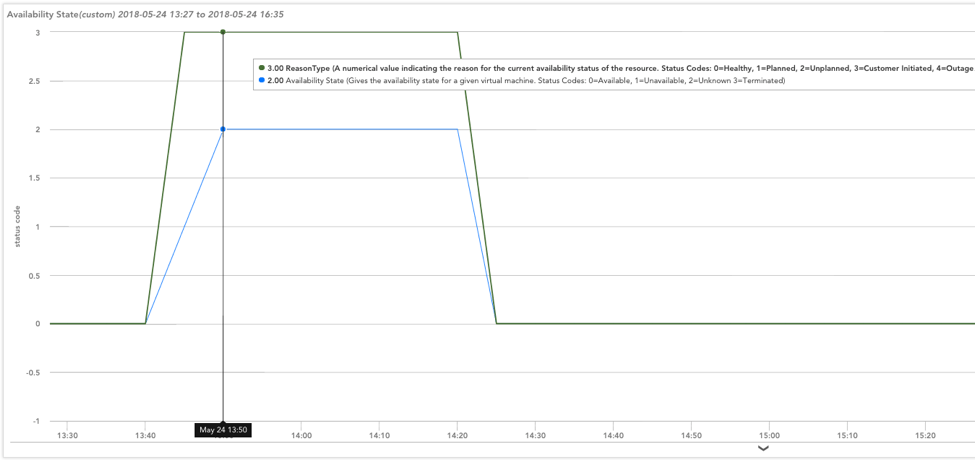
Previously, Azure Cloud resource state (e.g. terminated, running, stopped) was only available via the system.azure.status property. We are introducing a new Azure Status DataSource for monitoring resource state, so you can monitor and alert on status over time. In addition to resource status, you will also see an accompanying explanation – e.g. customer initiated, outage, etc. We are retrieving this status data from the Azure Resource Health API, and it will be available for all Azure resources that this API supports. You may find this new status data useful for identifying when Azure resources are in an undesirable state and triggering alerts. We plan to extend this functionality to AWS in an upcoming release.
Auto-Filled Alert Thresholds
Previously, in order to enable color-change thresholds across the Gauge, Big Number, and Dynamic Table Widgets, you would have to manually assign the alert threshold values. With v.105, we will automatically populate these thresholds with values from the selected DataSource’s global definition. This both streamlines the widget setup process and ensures consistent thresholds are set across your account.
Other Improvements
Alerting
- You can now use All Group Types (Website, Dynamic, etc.) in the External Alerting option.
- “Ack” responses to email alerts will now use a “no-reply” mail account. This change eliminates the risk of ongoing message loops.
Dashboards
- Added ability to specify the SLA period / time range for Websites in the SLA Widget & Report. This functionality already exists for Device SLA.
- When configuring percentage bars on the Dynamic Table Widget, you can now specify a minimum and maximum value other than 0 and 100. This allows you to visualize any datapoint as a percentage bar, not just those that are 0-100 by default.
- Dashboard search will display the full path of each dashboard, similar to Device Search, to help distinguish dashboards with the same display name in different groups.
- You will not be able to re-import Dashboards containing Website NOC, Website SLA, or Website status widgets that were exported before v.105. These dashboards should be re-exported in v.105.
Devices
- Previously, deleting a group & selecting not to delete the devices within resulted in the deletion of any sub-groups, and the transfer of any devices under those sub-groups to the root group. This orphaned cloud devices from their parent cloud account. To correct this moving forwards, we’ve made it such that cloud sub-groups are not deleted when a group is deleted & the user selects not to delete the devices within.
- Unified property value character constraints for devices, groups, services and collectors to be 6128 characters (does not include ILPs at this time).
LM Cloud
- Added support for discovering and monitoring Azure Data Lake Store and Data Lake Analytics services.
- AWS Cost & Usage reports are sometimes generated for previous billing cycles after the cycle ends, which previously cause spikes in data monitored in LogicMonitor. We’ve added logic to validate the date associated with the billing data to prevent such spikes in monitored data moving forwards.
- Limited the available collection intervals for Azure based DataSource collection methods to be consistent with the aggregation periods that Azure offers (1 min, 5 mins, 15 mins, etc.). Existing DataSources utilizing an Azure collection method at intervals no longer available will not be affected.
LogicModules
- A diff view is now available when importing LogicModules from file.
Reports
- When displaying the full group path in the Alert Trends report, the account root group will be displayed as “[company name]- (root)”.
REST API
- Previously, API filters for non-existent fields resulted in no filtering. We’ve added a new query parameter ‘validateFilterFields’ that defaults to false for continuity in behavior, but can be set to true to filter against field value and existence. You may find this new query parameter useful for filtering across resources that have different fields (e.g. filtering a GET all widgets that have a particular Device in the NOC items).
- Filtering on fields with special characters in the name didn’t always work well (e.g. filter=appliesTo:system.hostname =~ \”192.168.1.106\”). These types of filter values can now be enclosed in double quotes to ensure accuracy of filtering, like this: filter=appliesTo:”system.hostname =~ \”192.168.1.106\””
Websites
- We implemented some restrictions on our Websites property names. The following characters are permissible: ASCII letters “A” through “Z” (in a case-insensitive manner), the digits “0” through “9”, the hyphen “-“, period “.”, underscore ” _”, and spaces.
Bugs Fixed
- Fixed an issue that was sometimes preventing Poll Now from displaying the right fields for local Collector DataSources applied to cloud resources.
- When creating a new dashboard token, copying the token name cleared the value. This has been fixed.
- Users can now right-click copy scripted fields in DataSources/ConfigSources.
Monitoring Release Notes
Below is a list of new and improved LogicModules that were implemented since our last release:
New Monitoring Coverage
- Microsoft Azure Automation Account – 1 DataSource
- EMC XtremIO – 17 DataSources
- Microsoft Azure Billing – 5 DataSources
Cisco ASA Failover – 1 DataSource- replaces CiscoFWStatus & Cisco_ASA_Cluster. Now only discovers ASAs configured for failover.
- HashiCorp Consul – 20 DataSources, 2 PropertySources
Monitoring Improvements
- AWS Polling Intervals Increased – 13 DataSources
- for purposes of controlling Cloudwatch costs incurred
- Liebert PDU Receptacle – 1 DataSource
- corrected threshold and graphs for current reported in tenths of amps
- HashiCorp Nomad – 13 DataSources
- various fixes and improvements to the Nomad datasources
- NOTE : AppliesTo changes may cause data loss if existing modules in your LM account are not replaced
- MySQL – 1 DataSource
- various fixes and improvements
- Aruba IAP – 1 DataSource
- added alerting to status changes as well as improved alert messages
- Ubiquiti UniFi Access Points – 1 DataSource
- fix collection script and improve datapoints and graphs
- Microsoft Azure Virtual Machines – 1 Datasource
- increased polling interval to reduce stress on API poll limits
- Cisco_IOS – 1 Configsource
- Email Roundtrip Time – 1 Datasource
- added config information to tech notes
- Email Transit Time – 1 Datasource
- added config information to tech notes
- Cisco CUCM Processes – 1 Datasource
- added support for multiple process monitoring
- changed to batch script for improved performance
- Redis – 1 Datasource
- script stability improvements
- graphs updated to modern standards
- datapoint descriptions added