
v.112 Release: UI Enhancements and Support for Google Cloud Platform
Last updated on 14 September, 2022Our v.112 release will be rolled out the first half of November—and it’s a good one! In addition to offering a monitoring integration for Google Cloud Platform, it also features several new user interface enhancements designed to make LogicMonitor even more intuitive.
User Interface Enhancements
From Devices to Resources
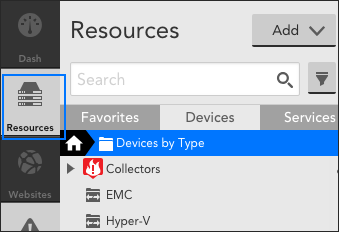
We’ve renamed the Devices page to be the Resources page! This change was made to reflect that infrastructure monitoring is more than just device monitoring (for example, with a hybrid infrastructure you’re likely also monitoring cloud resources) and to set the stage for new, non-device resource types we’re gearing up to release.
Throughout the application, you’ll see display labels have changed to reference “Resource” rather than “Device.” Note: API endpoint names have not changed.
Easy Identification of Alerts in SDT
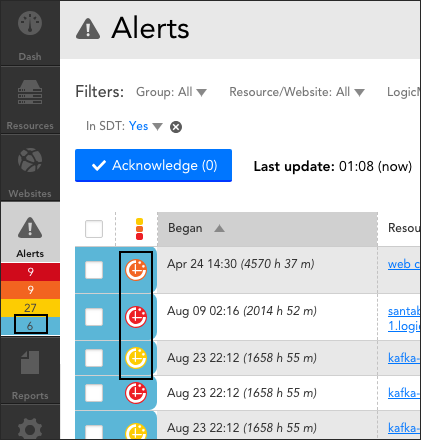
As requested by multiple customers, resources in SDT that have been alerted on will no longer be counted towards your other alert severity counters. Instead, alerts in SDT will be represented by a new light blue SDT alert counter located on the left side of your navigation pane. New icons have also been created so that you will still be able to identify the underlying severity of alerts in SDT.
This interface enhancement will help you better differentiate, identify, and prioritize alerts that need to be addressed. The counting of SDT alerts from the main navigation menu can be disabled from your account’s portal settings (Settings | Account Information | Portal Settings).
Support for Google Cloud Platform
All LM Cloud subscriptions now include support for Google Cloud Platform (GCP). Similar to AWS and Azure monitoring integrations, this new integration enables automated discovery of GCP resources, monitoring of GCP Stackdriver data, and out-of-the-box dashboards. Initially, monitoring is available for Compute Engine, App Engine, Cloud Functions, Cloud SQL, and Cloud Storage services, as well as for GCP service disruptions and quota usage. To get started, simply add your GCP projects into monitoring from Resources | Add | Cloud Account. For more information, see our Getting Started with LM Cloud documentation.
Other Improvements
Dashboards
- Map widget improvement. For the Map widget, devices in SDT will now show the new SDT icon as opposed to the device dead icon. If, once SDT has elapsed, these devices still show up as dead, users will be able to better differentiate areas that require attention.
LM Cloud
- Enhanced logic for delayed Azure services data. To accommodate delayed Azure Monitor data, LogicMonitor now retries data collection when no data is received for an Azure service. This configuration was already in place for AWS.
REST API
- NetFlow data support. The ability to retrieve NetFlow data has been published to the LogicMonitor REST API v2.
- NetScan support. The ability to programmatically manage NetScans has been published to the LogicMonitor REST API v2.
- Historical SDT support. The ability to retrieve historical SDTs has been published to the LogicMonitor REST API v2.
User Management
- New columns for Users table. The Users table now supports six additional display columns: Time Zone, Email, Phone, SMS Email Address, SMS Email Format, and View Permissions. (Upon upgrade to release v.112, the new Time Zone column will automatically display in the Users table; the other new columns can be optionally added via the Settings button.)
- User table settings management. A Settings button has been introduced on the Users page, allowing you to manage which user columns are displayed—and in what order.
LogicModule Releases
Next we’ve listed new and improved LogicModules that were implemented since our last release.
New Monitoring Coverage
- Google Cloud Platform – 5 DataSources
Monitoring Improvements
- Microsoft SQL Server – 1 PropertySource, 8 DataSources
- Various improvements to authentication type detection
- New troubleshooter to help identify common connection and permission issues