
v.118 Release: New SLA Calculation Method
Last updated on 14 September, 2022Rolling out through the end of April, v.118 features a new method of calculating how effectively your resources met their service-level agreement (SLA) targets, along with numerous other updates across LogicMonitor’s cloud monitoring, Collectors page, and REST API.
Release Highlight: New SLA Calculation Method
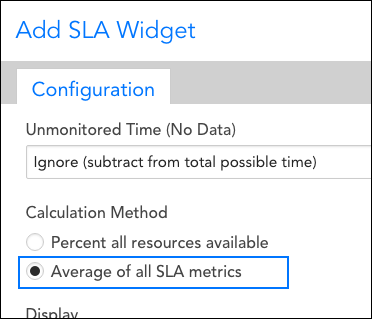
Previously, for both the SLA dashboard widget and SLA report, adherence to SLA was calculated by determining the percentage of time in which all resources tracked in the SLA simultaneously met their individual thresholds. With the release of v.118, a second calculation method is now available that averages the percentage of time in which acceptable service levels were maintained across all resources. The difference between these two calculation methods is subtle; to learn more about each and decide which is best for your tracking needs, see SLA Widget or SLA Report.
The original SLA calculation method (percentage of time in which resources simultaneously met their individual thresholds) will remain the default, but can easily be changed in the widget or report’s configuration settings. Note: Website SLAs have always been calculated under the hood based on average (not simultaneous) availability and that calculation is not affected.
Other v.118 Enhancements
Collectors
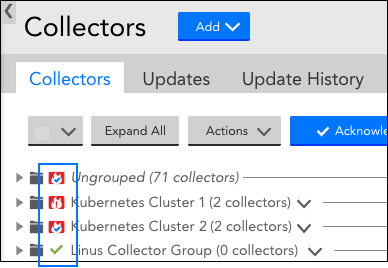
- Collector status icons propagate to group level. Alert statuses for Collectors will now “bubble up” to group level on the Collectors page. This new Collectors page UI functionality is similar to that seen on the resources tree. If members of a Collector group have differing statuses, the overall group status will be determined according to the following priority order, listed from highest to lowest priority:

- (Collector down)
- (Collector dead)
- (Collector down + SDT)
- (Collector down + ACK)
- (Collector down + SDT + ACK)
- (Collector SDT)
- (Collector clear)
If there are no alerts for any members of the Collector group, the clear checkmark (
) icon will display. - 32-bit Collector support ending. Support for 32-bit Collectors will end with EA 28.400, as part of our upgrade to JDK 11. If you have concerns, please reach out to your customer success manager or support. EA 28.400 will be released in approximately four weeks.
- Incorrect resource counts. The Collectors page was showing incorrect resource counts. this has been fixed.
 (Collector down)
 (Collector dead)
 (Collector down + SDT)
 (Collector down + ACK)
 (Collector down + SDT + ACK)
 (Collector SDT)
Integrations
- Import/export custom HTTP alert delivery integrations. The ability to import/export custom HTTP alert delivery integrations has been added. This functionality streamlines the sharing and set up of custom integrations that have not yet been added to the list of branded integrations.
LM Cloud
- Amazon Web Services (AWS) monitoring updates:
- AWS WAF Web ACL monitoring. Added support to discover and monitor CloudWatch metrics for AWS WAF Web ACLs (under the AWS account level device).
- Azure monitoring updates:
- Event collection for Azure Advisor. LogicMonitor has published a new EventSource that pulls in events from Azure Advisor. The severity of the event is mapped from the Azure Advisor risk field. You may find this useful for viewing security issues and other Azure recommendations alongside your monitored Azure environment within LogicMonitor.
- Dynamic metric aggregation specification. The ability to dynamically specify Azure metric aggregation, using the new ##primaryAggregation## token, has been added. This will be helpful in avoiding data collection issues that arise when Microsoft changes support metric aggregation methods.
- Google Cloud Platform (GCP) monitoring updates:
- Private IP addresses populated for GCE. Previously, private IP addresses for Google Compute Engine (GCE) instances without a public IP were not being populated. This has been fixed.
- Improved HTTP load balancer monitoring. Added support for discovering and monitoring individual backend services for GCP HTTP load balancers.
- General LM Cloud updates:
- RBAC bug fixed. A bug was identified that required users to have manage access to all parent groups to edit a cloud resource. This has been fixed & now aligns with standard LM RBAC, which requires that users have manage access only to a single parent group to edit a resource.
LM Container
- Select existing dashboard group for Kubernetes monitoring. Users can now select an existing dashboard group when adding a Kubernetes cluster into monitoring (vs. having to create a new one). This allows you to have a Kubernetes monitoring API user that is pre-configured for existing resource, Collector, and dashboard groups, thus minimizing permissions required.
- Specify etcd discovery token from Add Kubernetes wizard. You can now specify an etcd discovery token when adding your Kubernetes cluster into monitoring via the UI (it has always been an available field in the helm chart). You may find this useful for adding external etcd nodes into monitoring.
LM Service Insight
- Auto-creation of graphs for complex datapoints. Graphs are now auto-created for complex datapoints specified during service creation. Graphs were previously only auto-created for standard datapoints.
- Changing graph display priority. Added unique priority numbers for auto-created service graphs. You may find these useful for changing the display priority of a given graph.
LogicModules
- JobMonitors permit earlier execution times. Jobs monitored by JobMonitors can now start up to one minute earlier than configured start time without triggering an alert. This enhancement was implemented to avoid false alerts due to minor time variations between LogicMonitor and customer systems.
Mobile App
- 2FA support. LogicMonitor now enforces 2FA (two-factor authentication) on its mobile app, when enabled for a user. The process for logging into LogicMonitor via the mobile app using 2FA is the same as the process for logging into LogicMonitor via a mobile device’s web browser or the desktop version using 2FA. For more information on LogicMonitor’s support of 2FA, see Two-Factor Authentication.
REST API
- EventSource Retrieval. Published the ability to retrieve EventSources via the API.
- New timestamp for Websites resource. Added a lastUpdated timestamp to the Websites resource. You may find this useful for programmatically identifying Websites that have been updated since a specific timestamp.
LogicModule Releases
LogicModules that have been added or updated since the last release.
New Monitoring Coverage
- AWS Classic ELB Listener Usage – 1 DataSource
- Azure Advisor Recommendations – 1 EventSource
- GCP Compute Cloud Router – 1 DataSource
- Microsoft Azure SQL Elastic Pools – 1 DataSource
- Microsoft Azure VM Backups – 1 DataSource
Monitoring Improvements
- addCategory_NoPing – 1 PropertySource
- Updated AppliesTo logic
- Barracuda Networking – 1 AppliesTo function
- Added Barracuda networking device detection to isNetwork() AppliesTo function
- GCP Cloud Functions – 1 DataSource
- Minor adjustments to graphs
- HP 3PAR VLUN by Volume – 1 DataSource
- Improved regex pattern matching
- Kubernetes – 7 DataSources
- Introduced various performance improvements and efficiencies
- Kubernetes Node – 1 DataSource
- Max value removed from CPU Requests graph
- Kubernetes Cluster Aggregate – 1 DataSource
- Minor updates to graphs and datapoint definitions
- Kubernetes Pods, Containers and Scheduler – 3 DataSources
- Additional timeout support and script cleanup
- Linux SSH – 7 DataSources, 2 PropertySources
- Fixed hanging connections and timeouts
- NetApp Cluster Disks – 1 DataSource
- Error fixed in collection script to handle null and empty response exceptions
- NetApp Cluster SnapMirror – 1 DataSource
- Additional description information added to unhealthy_reason datapoint
- NetApp System Info – 1 PropertySource
- Fixed error in AD script for missing SSL call
- SonicWall SonicOS – 1 ConfigSource
- Improved exception handling for discovered instances
- VMware ESXi & vCenter – 11 DataSources
- Minor script cleanup/updates, updated host status datapoints
- VMware vCenter Network Status – 1 DataSource
- Corrected issue with AppliesTo function