
v.128 Release: AIOps Early Warning System (Phase One)
Last updated on 14 September, 2022Rolling out through the end of November, LogicMonitor v.128 brings phase one of LogicMonitor’s AIOps early warning system. New monitoring for Cisco VoIP server/client traffic comes with v.128 as well, along with a new remote support access status display that indicates whether LogicMonitor support is able to access your platform for troubleshooting purposes.
IN THIS RELEASE:
- Release Highlight: AIOps early warning system (phase one)
- Release Highlight: Ongoing topology mapping enhancements
- New and Updated Monitoring Coverage: New monitoring for Cisco VoIP and Veeam Backup & Replication
- Other v.128 Enhancements: Remote support access display
- Looking Ahead: Integrations page (new!)
Release Highlight: AIOps Early Warning System (Phase One)
Several of LogicMonitor’s ongoing AIOps initiatives are converging in v.128 to provide sophisticated alert intelligence that reduces alert noise and brings into sharp focus those alerts that require action.
These new features represent phase one of LogicMonitor’s early warning system, which will ultimately serve to proactively warn engineers and IT operations teams before issues occur, and provide a platform to prevent failures.
Note: Root cause analysis and dynamic thresholds will be activated for customer portals after v.128 has been fully rolled out. (**Update: As of 12/6, root cause analysis was fully rolled out and, as of 12/13, dynamic thresholds were fully rolled out.) These AIOps features are available to users of LogicMonitor Enterprise; however, initially, all portals will have access to them on a trial period basis through January 15, 2020. To ensure full functionality, we strongly recommend you use the new Alerts page in conjunction with these new AIOps features.
Root Cause Analysis
Root cause analysis leverages the auto-discovered relationships among your monitored resources (as discovered by LogicMonitor’s topology mapping feature) to determine the root cause of an incident that is impacting dependent resources.
When enabled for your alerting operations, root cause analysis highlights the originating cause of the incident, while optionally suppressing notification routing for those alerts determined to be dependent on the originating alert. This significantly reduces alert noise, allowing you to quickly identify root cause.
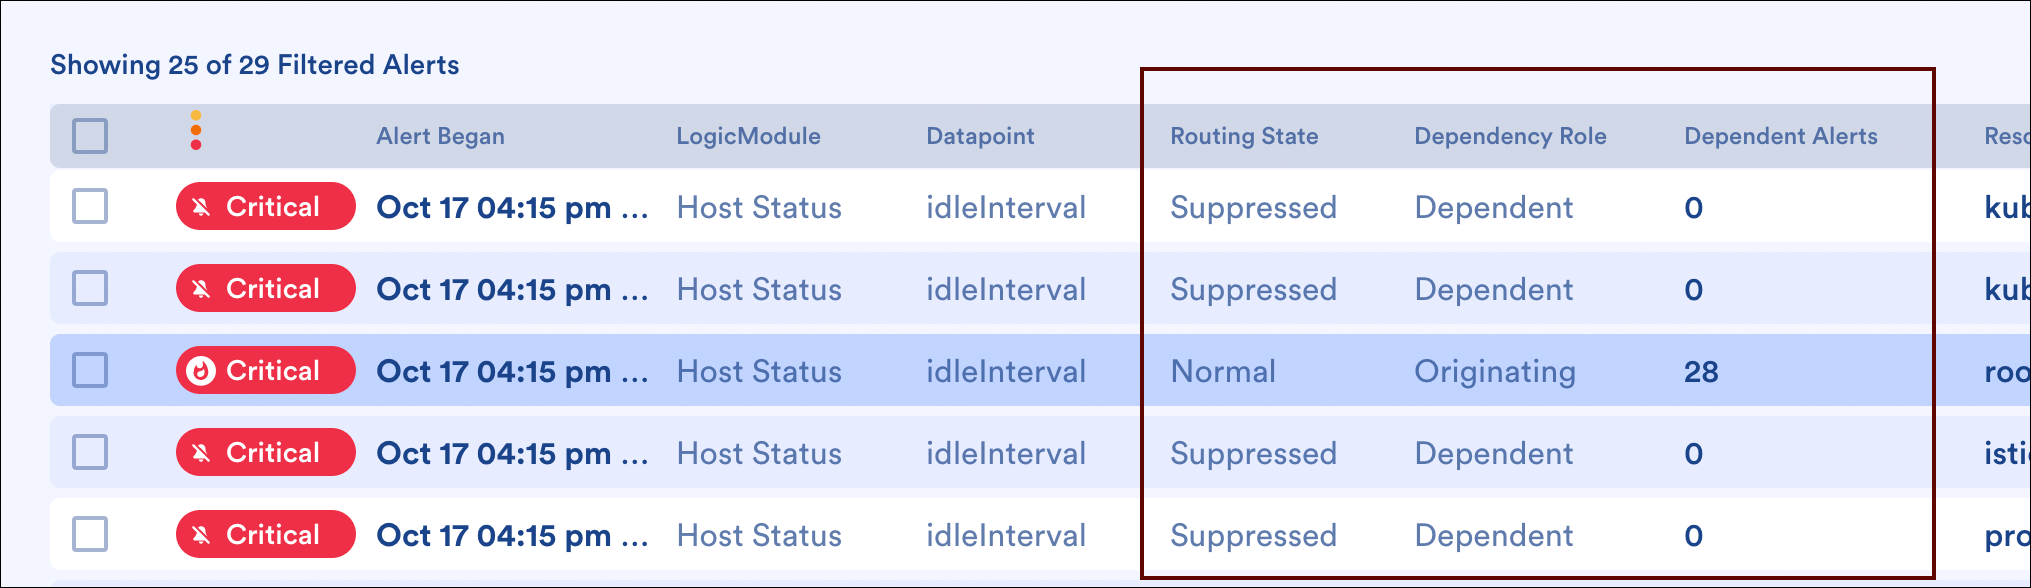
▲ Alerts that undergo root cause analysis are assigned additional data, including whether the alert is an originating or dependent alert, if its notification was suppressed due to being deemed dependent, and the number of dependent alerts, if any, that occurred downstream from it. The Alerts page can be filtered based on this dependency data to help you focus in on actionable alerts.
Root cause analysis is triggered when a resource goes down or becomes unreachable, as determined by the PingLossPercent or idleInterval datapoints, which are associated with the Ping and HostStatus DataSources respectively.
For more details and setup instructions, see Enabling Root Cause Analysis.
Note: Topology mapping is the backbone of root cause analysis. As discussed in the
Release Highlight: Ongoing Topology Mapping Enhancements section of these release notes, ensure your portal uses the most recent topology-related LogicModules.
Dynamic Thresholds
Built upon LogicMonitor’s anomaly detection visualization AIOps feature, which was released earlier this year, dynamic thresholds represent the bounds of an expected data range for a particular datapoint. These thresholds are based on anomaly detection algorithms that evaluate the three days of historical data immediately preceding.
When enabled for your alerting operations, dynamic thresholds are evaluated to determine whether a particular alert represents anomalous data (i.e. data that falls outside of the bounds of the expected data range) or non-anomalous data. If the data is determined to be anomalous, the subsequent alert notification is routed; if it is determined to be non-anomalous, the subsequent alert notification is suppressed.
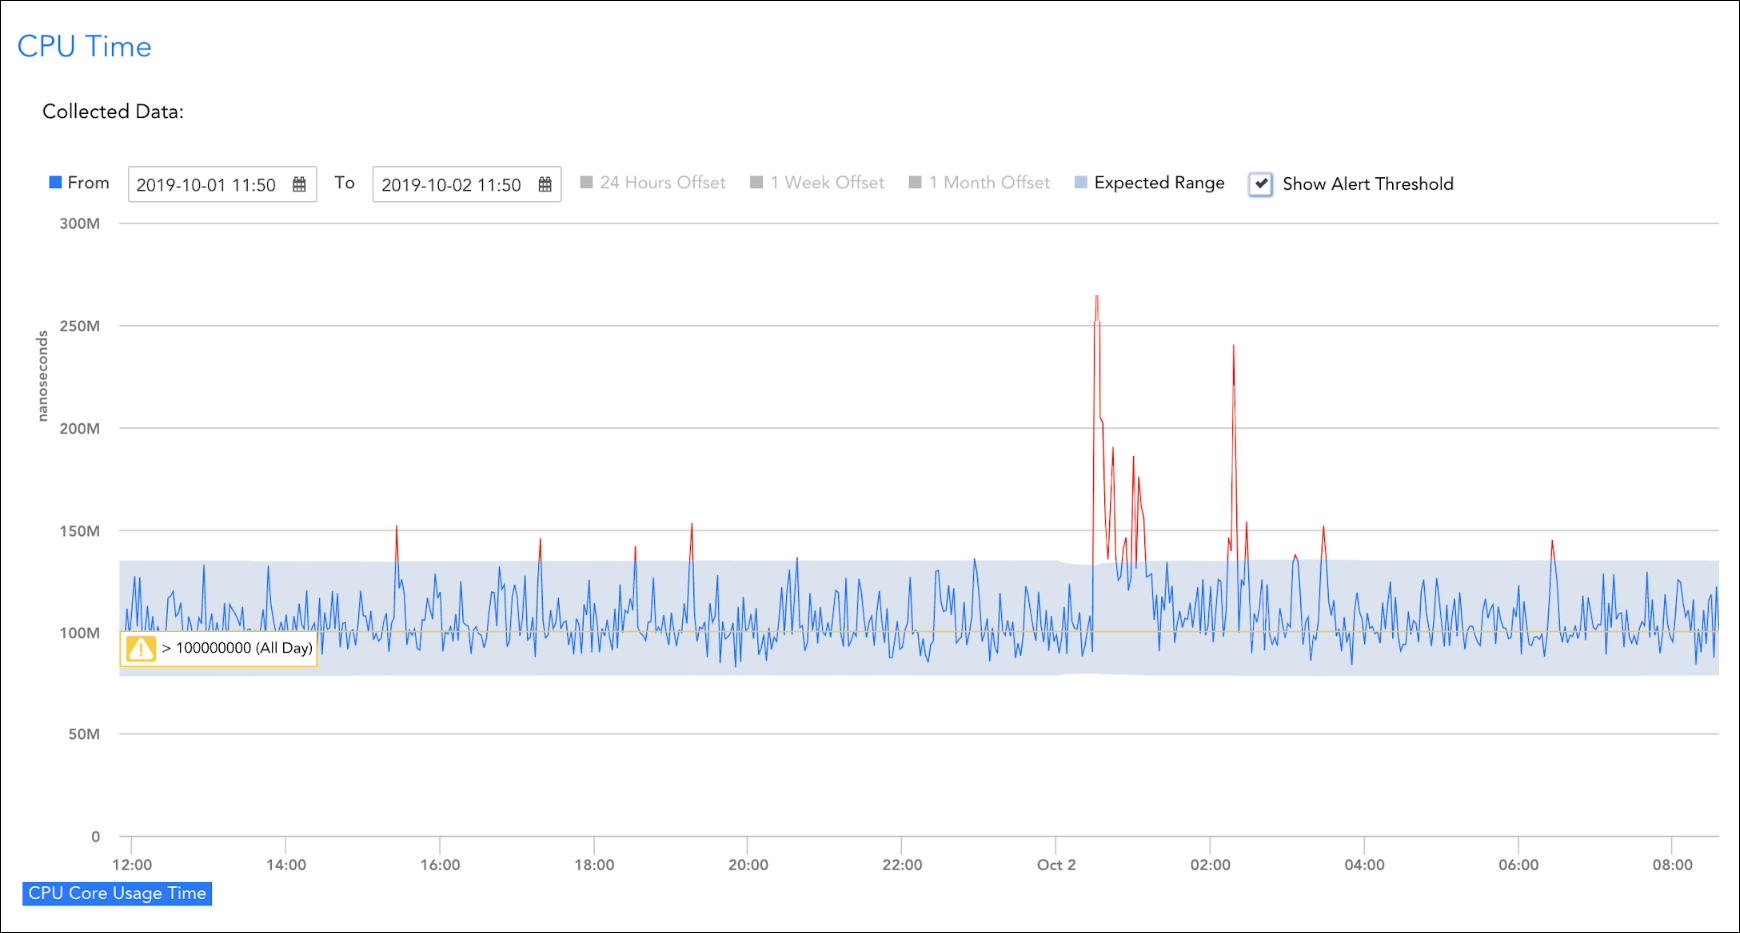
▲ In this anomaly detection graph, the static threshold for the datapoint is set at >100,000,000 nanoseconds. Although many values exceed this threshold over the course of the 20 hours depicted here, the majority of them still fall within the expected range, which is shaded in blue. If dynamic thresholds were enabled for this datapoint, only those alerts triggered by the red values (i.e. those values surpassing the upper bounds of the expected range) would have their notifications routed; all other alert notifications would be suppressed.
The goal of dynamic thresholds is to filter routed alert notifications to just those that represent anomalous data, thus reducing alert noise and ensuring that only those issues truly requiring attention are being sent out to your team. Regardless of whether alert notifications are routed or suppressed based on dynamic thresholds, the alert always displays within the LogicMonitor interface.
For more details and setup instructions, see Enabling Dynamic Thresholds for Datapoints.
Release Highlight: Ongoing Topology Mapping Enhancements
Significant enhancements have been made to the methods used by topology mapping to establish relationships among devices. These new methods are extensible, allowing topology mapping coverage to grow in a more predictable and scalable manner. Extending coverage is a primary focus of our development efforts and we will continue to add coverage via new and updated LogicModules (i.e. TopologySources, DataSources, and PropertySources).
Over the past couple of releases, we have also delivered several solutions to address the issue that was causing the wrong devices to be displayed on topology maps. Many of these solutions are implemented within topology-related LogicModules. For this reason, it is important that all topology-related LogicModules in your platform are up to date, including:
- All TopologySources
- All PropertySources prefixed with “addERI_” (e.g. addERI_Cisco, addERI_Vcenter, etc.)
- The addCategory_TopoSwitch PropertySource
- All DataSources currently in use (for some types of resources, notably VMware and Kubernetes (there are others as well), DataSources carry some instructions for topology mapping)
Updating to the latest LogicModules will temporarily remove all topology connections while new keys and connections are generated—this is expected behavior. After all DataSources, PropertySources, and TopologySources have had a chance to run, any remaining issues should be referred to support for investigation and resolution. For more information, see Topology Mapping Overview.
New and Updated Monitoring Coverage
Upon your account’s upgrade to v.128, import our new and updated LogicModules from the LogicMonitor repository to expand and enhance your monitoring coverage.
New Monitoring Coverage
- Cisco VoIP – 13 DataSources, 2 PropertySources
- Monitors a variety of VoIP server/client traffic, including connections, redirects, retries, and errors—as captured by Cisco call management systems such as CUBE (Cisco Unified Border Element). See Cisco VoIP Monitoring for details on this new monitoring package.
- Citrix EUEM – 1 PropertySource
- The new addCategory_CitrixEUEM PropertySource checks for the existence of the Citrix_EUEM WMI class and, if found, adds the value of “CitrixEUEM” to the system.categories property. This value is required in order for some Citrix DataSources to apply appropriately.
- Topology mapping Citrix NetScaler – 1 PropertySource, 1 TopologySource
- To ensure that Citrix NetScaler systems properly display edges on topology maps, import the addERI_Netscaler PropertySource and the Netscaler_HA TopologySource.
- Dell EMC Data Domains File Systems – 1 DataSource
- The new DellEMC_DataDomain_FileSystems DataSource replaces the deprecated DataDomainFileSystems- DataSource. It addresses issues with instance collisions and brings improvements to datapoints, graphs, and alerting. If the deprecated DataSource is currently in use in your environment, we recommend disabling it after importing the new one. When a DataSource is disabled, it stops querying the host and generating (duplicate) data and alerts, but still maintains all historical data. For more information on disabling DataSources, see Disabling Monitoring for a DataSource or Instance.
- Veeam Backup and Replication Jobs: [SureBackups | VMWare SureBackups | Windows Agent] – 3 DataSources
- New DataSources have been added to the Veeam Backup & Replication Monitoring package to additionally monitor backup job metrics for SureBackups, VMWare SureBackups, and Windows Agent backups. For more information on this package, see Veeam Backup & Replication Monitoring.
Updated Monitoring Coverage
- Topology mapping Updated PropertySource – 8 PropertySources
- For improved topology mapping functionality, update the following PropertySources: addCategory_TopoSwitch, addERI_Arista, addERI_Cisco, addERI_Device, addERI_HPSwitch, addERI_Huawei, addERI_Juniper, and addERI_Linux.
- Topology mapping Updated TopologySources – 2 TopologySources
- For improved topology mapping functionality, update the VMware_vCenter_Topology and Networking_L2_snmpSwitch TopologySources.
- Citrix XenApp Delivery Groups – 1 DataSource
- Fixed issue that was causing unregistered machines to not be reported properly.
- Collector Buffer DataReport Latency – 1 DataSource
- Removed an unnecessary alert threshold.
- Dell EMC Data Domains File Systems – 1 DataSource
- The DataDomainFileSystems- DataSource has been replaced by DellEMC_DataDomain_FileSystems. This new DataSource addresses issues with instance collisions and brings improvements to datapoints, graphs, and alerting. If the deprecated DataSource is currently in use in your environment, we recommend disabling it after importing the new one. When a DataSource is disabled, it stops querying the host and generating (duplicate) data and alerts, but still maintains all historical data. For more information on disabling DataSources, see Disabling Monitoring for a DataSource or Instance.
- F5 BigIP Fans – 1 DataSource
- Fixed issue with a key-value pair in the FanStatus datapoint.
- EMC [LUN Statistics | Raid Group | Storage Pools] NaviSecCLI – 3 DataSources
- Applied major active discovery (AD) and collection script rewrites to move from legacy file caching mechanisms to BatchScript.
Important: Upon update, customers that have been using these DataSources can safely delete any files in the [collector install folder]/bin/tmp directory whose names begin with “RGLog-” or “RGData-“. These files were created by the old collection method and and are no longer needed.
- Applied major active discovery (AD) and collection script rewrites to move from legacy file caching mechanisms to BatchScript.
- HP 3PAR Volumes – 1 DataSource
- Updated regex for improved instance matching.
- Juniper JUNOS – 1 ConfigSource
- Made major improvements that reduce script complexity; added SSH retry logic.
- Linux SSH – 1 PropertySource
- The updated addCategory_Linux_SSH PropertySource fixes an issue in the AppliesTo logic.
- Microsoft Exchange – 1 PropertySource
- The updated addCategory_MicrosoftExchange PropertySource features script improvements to exclude identification against language packs.
- Veeam Backup and Replication [HyperV Proxy Server | Job Backups | Job Backup Sync | Job Config Backup | Job Copies | Job Replicas | Repositories | VMWare Proxy Server] – 8 DataSources, 1 PropertySource
- Fixed various issues; efficiency improvements; datapoint and graph improvements; updated addCategory_Veeam_BackupAndReplication_PowerShell PropertySource.
- VMware VCSA – 10 DataSources
- All DataSources in this package (with the exception of the VMware_VCSA_VCDB DataSource) have been updated with API resource references in tech notes, and feature improved datapoints and graphs.
- WinProcessStats- – 1 DataSource
- Made various improvements to datapoints, alert messages, and graphs.
Other v.128 Enhancements
Alerting
- SDT dialog. Previously, in the newly-released Alerts page UI, the SDT dialog was unresponsive. This issue has been corrected.
LM Cloud
- Added new Azure regions for monitoring. Resources can now be monitored from the following Azure locations: south-africa-north, south-africa-west, australia-central, australia-central-2, france-south, germany-central, germany-north, germany-northeast, korea-central, korea-south, switzerland-north and switzerland-west
Resources
- Character limit for resource property values extended. The character limit for the values assigned to device/resource properties has been extended to 24,000 characters. An important impetus for this change was to allow Services with many grouped instances to be created via LogicMonitor’s REST API.
Topology Mapping
 Updated vertex icon colors. The icons representing vertices on topology maps have been updated to all use consistent standard LogicMonitor colors. Vertices that are not currently in focus will display icons that are smaller and lighter in color. Vertices that are currently in focus will display icons that are larger and darker in color. Vertices that are currently in alert will display an icon that is bordered by the same color as the alert color. These icon updates were made to better highlight resources currently in an alert state.
User Interface
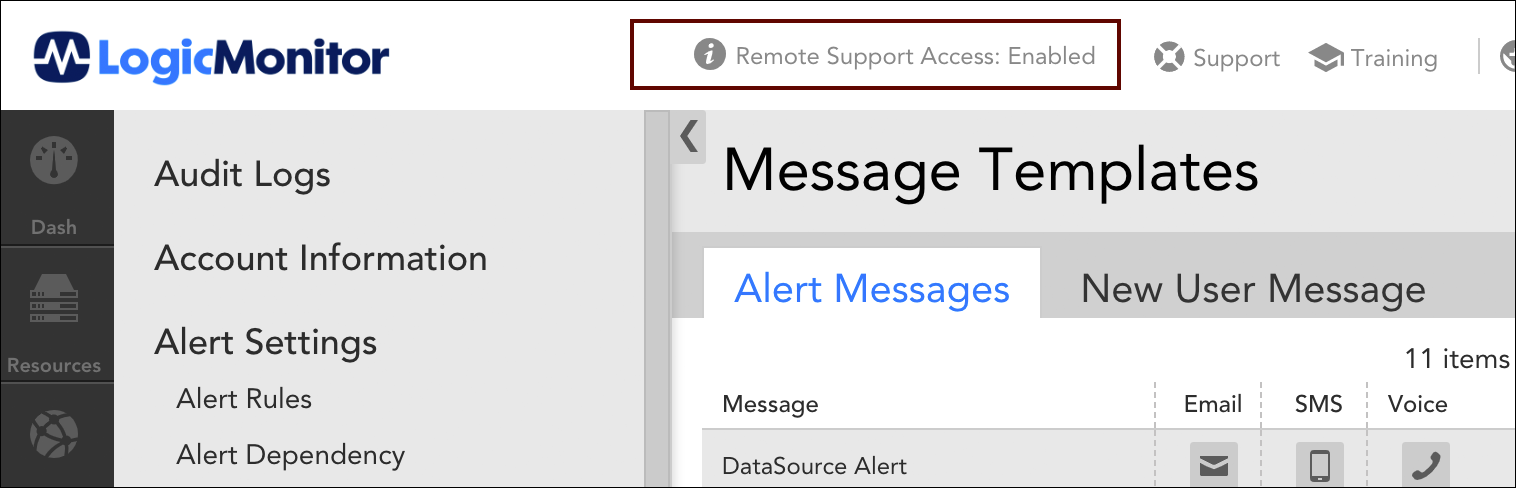
- Remote support access status display. LogicMonitor’s top header menu now displays the current status of remote support access. This status display indicates whether LogicMonitor support has the ability to access your portal for troubleshooting purposes, as determined by the “lmsupport” user. To remove access, find the lmsupport user in your portal (Settings | Users & Roles | Users) and update its status to “Suspended”. To change the level of access for this account, update its roles/privileges as you would for any other user account. For more information, see Users.
Looking Ahead: Integrations Page (new!)
As part of LogicMonitor’s ongoing UI initiative, we’ll soon be launching a brand new interface for the management of LogicModules. This new interface, called the Integrations page, will provide a centralized view into all LogicModule integrations (e.g. DataSources, PropertySources, EventSources, etc.) that are available for use in your monitoring activities.
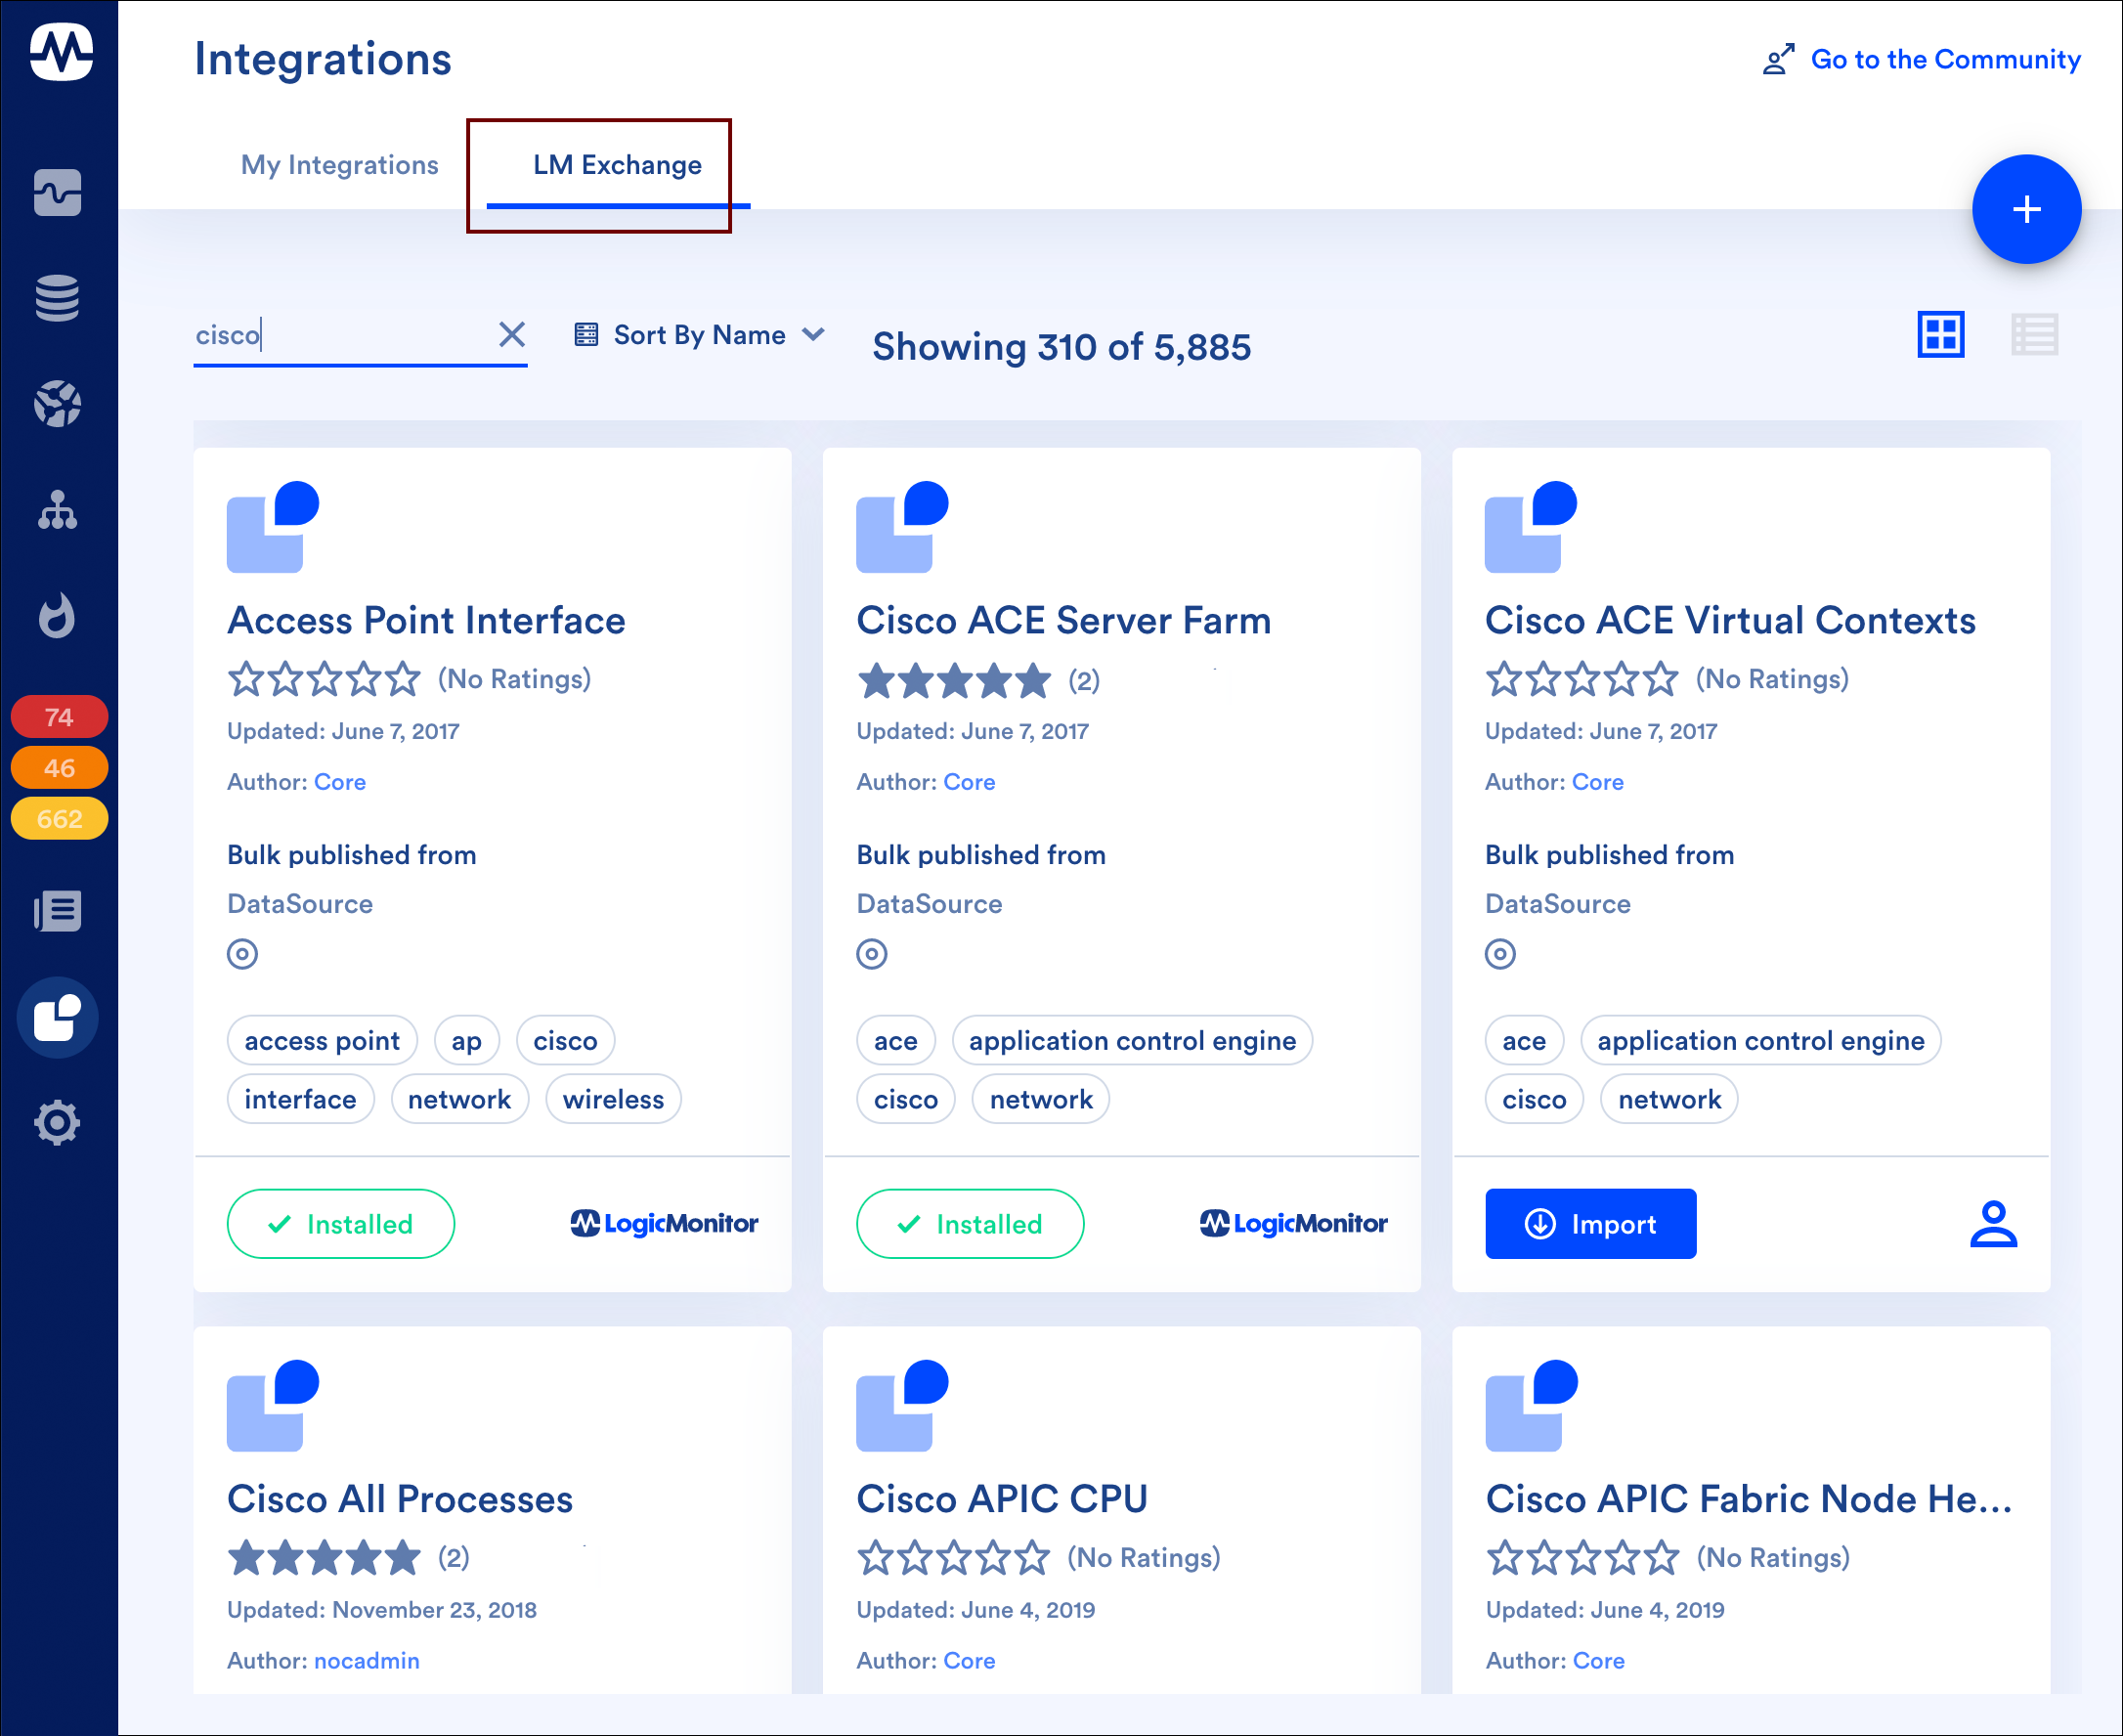
▲ The new Integrations page brings the LogicMonitor repository right into the platform. Using the LM Exchange tab, you can easily browse, search, and import new and updated LogicModules—whether published by LogicMonitor or by a member of the LogicMonitor user community. (UI image captured from alpha version; subject to change.)