
v.129 Release: Final Release of 2019
Last updated on 14 September, 2022LogicMonitor’s v.129 release is the 16th—and final—release of 2019. It caps off a year of innovative new features and important enhancements including Auto-Balanced Collector Groups, topology mapping, new remote session protocols, dynamic datapoint thresholds, root cause analysis, vastly expanded public cloud monitoring, and much, much more.
Rolling out through the middle of December, v.129 highlights include new monitoring for AWS EMR, AWS Transit Gateway, and Oracle, as well as several Alerts page UI enhancements.
Note: With v.128, we announced the release of phase one of our early warning system, initially slated to go live at the end of November. Since then, root cause analysis has been fully rolled out, but we are continuing to enable all aspects of dynamic thresholds across customer portals. We anticipate this work to be completed around mid-December and will extend the one-month trial period accordingly.
IN THIS RELEASE:
- New and Updated Monitoring Coverage: AWS EMR, AWS Transit Gateway, Oracle, Windows (via SNMP), and more
- Other v.129 Enhancements: Root cause analysis and Alerts page UI updates; new NetScan configuration
- Looking Ahead: Integrations page
New and Updated Monitoring Coverage
Upon your account’s upgrade to v.129, import our new and updated LogicModules from the LogicMonitor repository to expand and enhance your monitoring coverage.
New Monitoring Coverage
- AWS EMR – 6 DataSources
- Monitors EMR (Elastic Map Reduce) application, cluster, node, and backup statuses as reported by CloudWatch.
- AWS VPC Transit Gateway – 1 DataSource
- Gathers AWS Transit Gateway performance data as reported by CloudWatch.
- Topology mapping Cisco HSRP – 1 TopologySource
- Expanded topology mapping support for Cisco HSRP.
- Dell Compellent – 1 PropertySource
- The addCategory_Dell_Compellent PropertySource adds a system category value of “Dell_Compellent” to all identified Dell Compellent hosts. As discussed in the
Updated Monitoring Coverage section of these release notes, the AppliesTo logic for all Dell Compellent DataSources has been updated to look for this new category.
- The addCategory_Dell_Compellent PropertySource adds a system category value of “Dell_Compellent” to all identified Dell Compellent hosts. As discussed in the
- NetSNMP Memory Usage – 1 DataSource
- The new NetSNMP_Memory_Usage DataSource replaces the deprecated NetSNMPMem DataSource. It supports multiple CDP calculations for NetSNMP 5.4.0+. If the deprecated DataSource is currently in use in your environment, we recommend disabling it after importing the new one. When a DataSource is disabled, it stops querying the host and generating (duplicate) data and alerts, but still maintains all historical data. For more information on disabling DataSources, see Disabling Monitoring for a DataSource or Instance.
- Oracle – 19 DataSources, 2 PropertySources
- The Oracle monitoring suite has been extensively restructured to support multi-database configurations and containerization, as well as to improve and modernize coverage. See Oracle Monitoring for setup and migration details.
- Windows SNMP [Memory | Windows Services | Disk Volumes] – 3 DataSources, 1 SNMP SysOID Map
- Three new DataSources and one SNMP SysOID Map have been added to support monitoring Windows via SNMP. As discussed in the Updated Monitoring Coverage section of these release notes, several existing SNMP DataSources have also been updated to work with Windows hosts that have SNMP configured.
Updated Monitoring Coverage
- Aruba IAP Global Stats – 1 DataSource
- Fixes issue in alert clear threshold; minor graph updates.
- AWS DirectConnect – 1 Datasource
- Replaced and improved the noisy ConnectionCRCErrors datapoint; various graph improvements.
- Cisco Memory – 1 DataSource
- Removed Cisco ASA restrictions from the AppliesTo logic. Cisco ASA devices were previously excluded from this DataSource’s monitoring due to Cisco bug that historically caused CPU spikes. With Cisco’s firmware release 9.3, this issue is no longer present.
- Citrix NetScaler Full Backup – 1 ConfigSource
- The updated Citrix_Netscaler_FullBackup ConfigSource features various script fixes to address prompt detection failures.
- CPU Cores – 1 DataSource
- Extended AppliesTo logic to ensure Palo Alto compatibility as well as compatibility with Windows hosts that have SNMP configured; various other minor improvements.
- Dell Compellent – All 16 DataSources
- Updated AppliesTo logic to look for the new category set by the new addCategory_Dell_Compellent PropertySource (also released with v.129). This addresses issues with the SNMP agent on the host truncating the system.sysinfo which then prevented the DataSource from applying to some hosts.
- Fortinet FortiOS – 1 ConfigSource
- The updated Fortinet_FortiOS ConfigSource features an updated description and technical notes to correctly specify ssh.user and ssh.pass rather than out-of-date config.xxx properties.
- HPE Networking – 1 ConfigSource
- The updated HPE_Network_Config ConfigSource features an additional wait in script before prompt detection and a fix to the debug log location.
- IPMI Events – 1 EventSource
- The IPMI_Events EventSource has been updated for improved DNS resolution. Additionally, its name has been changed to IPMI Events (no underscore). If the deprecated EventSource is currently in use in your environment, we recommend deleting it after importing the new one.
- Linux SSH – 1 PropertySource
- Fixed issue in script when handling ports.
- Linux Disk Inodes – 1 DataSource
- Fixed issue in collection script regex; various improvements to datapoint descriptions and graphs.
- MongoDB Databases – 1 Datasource
- Fixed issue with multi-port setup; added new graphs and cleaned up existing graphs.
- MySQL – 1 PropertySource
- The updated addCategory_MySQL PropertySource improves socket management on MySQL server discovery.
- NetApp Cluster [LUNs | Status] – 2 DataSources
- Fixed issues in collection scripts to handle certain counter limitations and detect broken disks respectively.
- NetApp E-Series – All 12 DataSources, 1 PropertySource
- Changes NetApp made to its SANtricity API dictate that calls should now be made directly to the device instead of a central system manager. All NetApp E-Series LogicModules have been updated to support this change. Important: If data collection for your NetApp E-Series has stopped or you are receiving 424 errors when clicking Poll Now from the Resources page, update the device’s associated netapp.rest.url property to reference the device IP rather than the SANtricity Storage Manager address.
- NetSNMP Memory Usage – 1 DataSource
- The new NetSNMP_Memory_Usage DataSource replaces the deprecated NetSNMPMem DataSource. It supports multiple CDP calculations for NetSNMP 5.4.0+. If the deprecated DataSource is currently in use in your environment, we recommend disabling it after importing the new one. When a DataSource is disabled, it stops querying the host and generating (duplicate) data and alerts, but still maintains all historical data. For more information on disabling DataSources, see Disabling Monitoring for a DataSource or Instance.
- Oracle – 19 DataSources, 2 PropertySources
- The Oracle monitoring suite has been extensively restructured to support multi-database configurations and containerization, as well as to improve and modernize coverage. See Oracle Monitoring for setup and migration details.
- SNMP Interfaces [snmpIf- | snmp64_If] and SNMP TCP/UDP – 3 DataSources
- Extended AppliesTo logic to provide coverage for Windows hosts that have SNMP configured (the same was done for the CPU Cores DataSource); minor improvements to datapoints, alerts, and graphs. As discussed in the New Monitoring Coverage section of these release notes, three new Windows SNMP DataSources and one new SNMP SysOID map have also been created to work with Windows hosts that have SNMP configured.
- SonicWall SonicOS – 1 ConfigSource
- Performed major refactor on the SonicWall_SonicOS ConfigSource’s AD and collection scripts for improved execution and prompt detection.
- Topology mapping Updated PropertySources – 4 PropertySources
- For improved topology mapping functionality, update the following PropertySources: addERI_Cisco_ASA, addERI_Device, addERI_Juniper, and addERI_Linux.
- Topology mapping Updated TopologySources – 5 TopologySources
- For improved topology mapping functionality, update the Kubernetes_Node_Topology, Kubernetes_Pod_Topology, Kubernetes_Service_Topology, Networking_L2_snmpSwitch and VMware_vCenter_Topology TopologySources.
- VMware ESXi Host CPU Cores – 1 DataSource
- Added a graph that summarizes the average percent busy of CPU cores.
Other v.129 Enhancements
Early Warning System
- Root cause analysis triggered by any level of alert severity. Previously, only alerts with a severity level of critical triggered root cause analysis. Now, alerts of any severity level raised for the Ping-PingLossPercent or HostStatus-idleInterval datapoints will trigger root cause analysis for resources that are part of an identified dependency chain.
LM Container
- Argus no longer overwriting system.categories for monitored deployments. For Kubernetes deployments, Argus, in some cases, overwrote values for the system.categories property. Specifically, “NoPing” values, which resulted in the incorrect application of (and therefore no alerting for) the Ping DataSource. A new version of Argus is available with v.129 that corrects this, but please note that this correction involves labels no longer being added to system.categories. Your Kubernetes cluster is likely configured to auto-pull this new Argus version, or you can update your Helm deployment to pull the new version.
LM Cloud
- New cloud.primaryIP property allows you to override the IP used to collect local collector-based data for AWS EC2 instances, Azure VMs, and GCP Compute Engine Instances. You may find this useful if your instances have more than one IP (in which case the collector defaults to picking the first private IP), and you want to choose which IP is used for data collection.
NetScan
- Ignore system.ips when checking existing devices for duplicates. When adding an advanced NetScan policy, a new option labeled Ignore system.ips when checking existing devices for duplicates is available for advanced NetScans that use the ICMP ping method to scan the network. This option, when checked, allows for discovery of devices that share an IP with a device already in monitoring, as determined by the system.ips property.
RBAC
- View access required for accessing API tokens. In some cases, users without appropriate view permissions could read their API token via API request. This has been fixed.
Tokens
- New ##DSNAME## token. A new token, ##DSNAME##, is now available for use in alert messages. This token resolves to the DataSource name (not to be confused with ##DATASOURCE##, which resolves to the DataSource display name).
User Interface
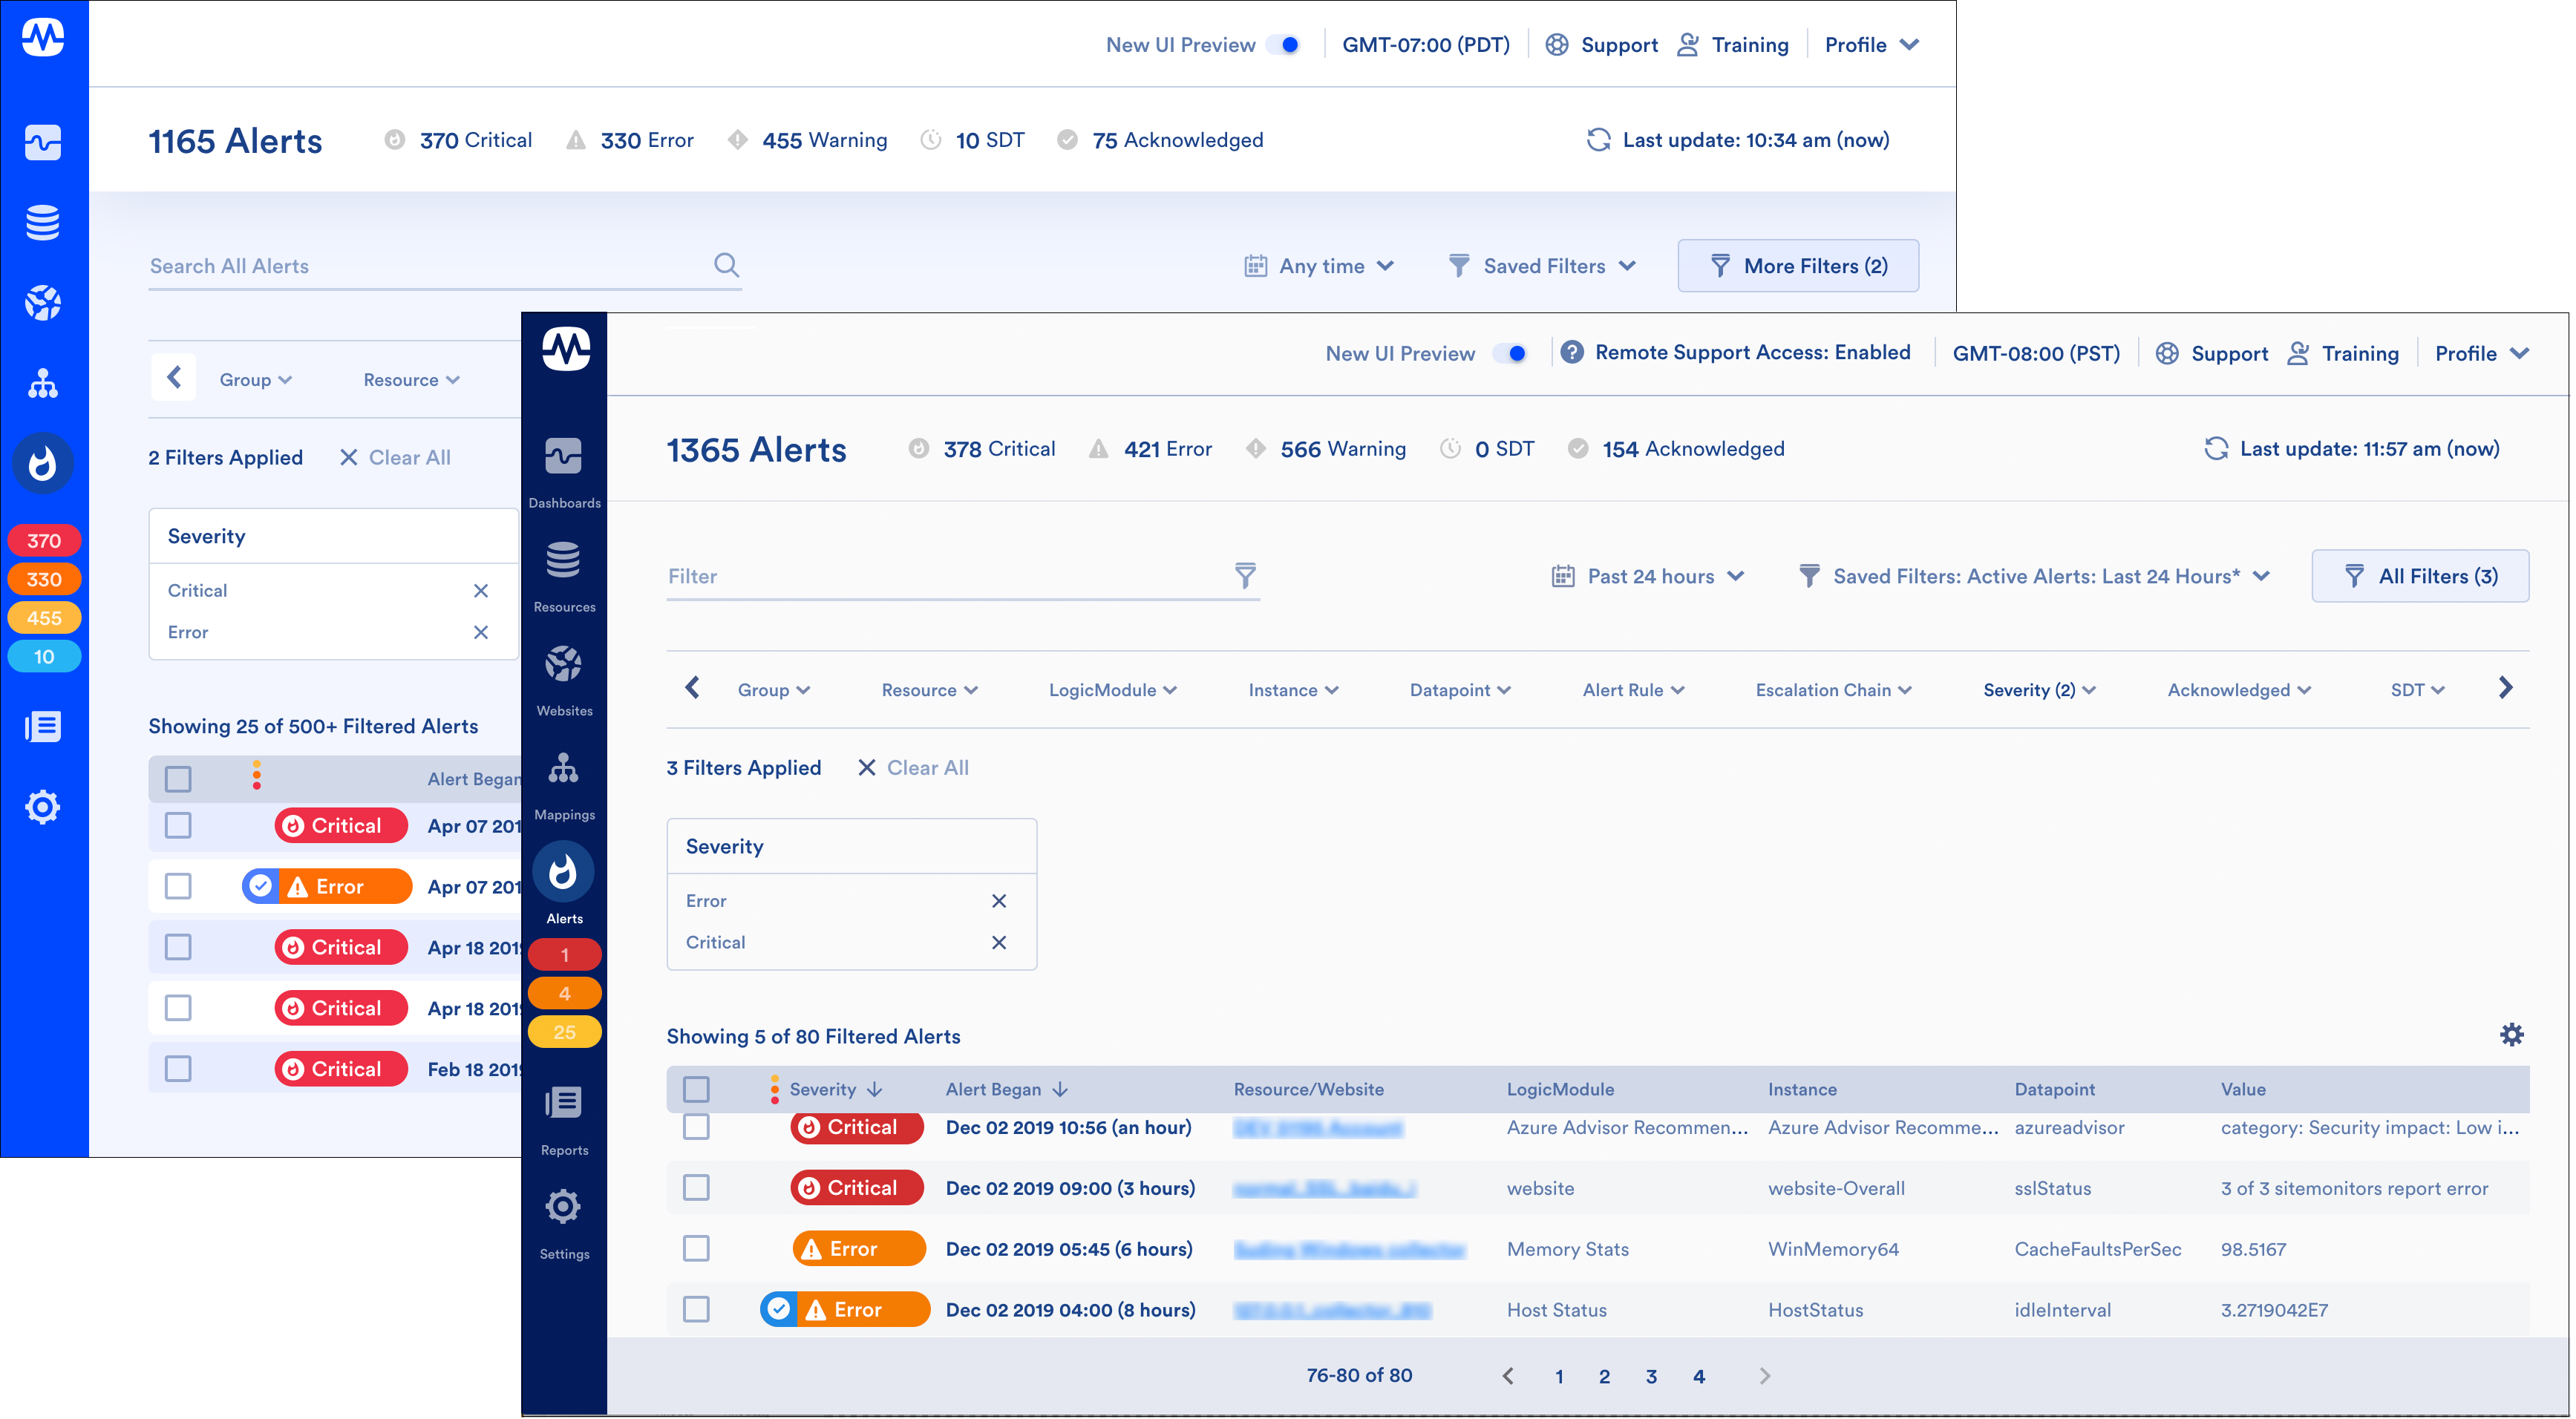
- Various UI improvements to Alerts page. As a result of user feedback, several UI changes have been made to the Alerts page, including:
- The left-hand navigation menu that displays while on the new Alerts page has been darkened and features menu labels.
- The page background has been changed from blue to gray.
- The text in the Resource/Website column now clearly reflects that the listed resource or website is a hyperlink.
- The Search field is now labeled Filter.
- The More Filters button is now labeled All Filters.

▲ As a result of user feedback, the left-hand navigation menu has been darkened and now features menu labels, and the background color of the Alerts page has been changed from blue to gray.
- Restored editing effective thresholds functionality from the expanded detail view for an alert. Previously, in the new Alerts page, the edit effective thresholds icon available from an alert’s expanded detail view was not responding. This has been fixed.
- Improved behavior for alert filters that support glob expressions. For alert filters that support text strings (e.g. group, resource, LogicModule, datapoint, etc.) and therefore glob expressions, the option to define a glob expression now displays before suggested results.
- Financial tab. The financial data found on the Financial tab of the Account Information page (Settings | Account Information | Financial), is displaying normally once again.
- Fixed usage issue for two time zones. Use of Japan and America/North_Dakota/Beulah time zones were, in some cases, causing the UI to freeze.
Looking Ahead: Integrations Page
As part of LogicMonitor’s ongoing UI initiative, we’ll soon be launching a brand new interface for the management of LogicModules. This new interface, called the Integrations page, will provide a centralized view into all LogicModule integrations (e.g. DataSources, PropertySources, EventSources, etc.) that are available for use in your monitoring activities.
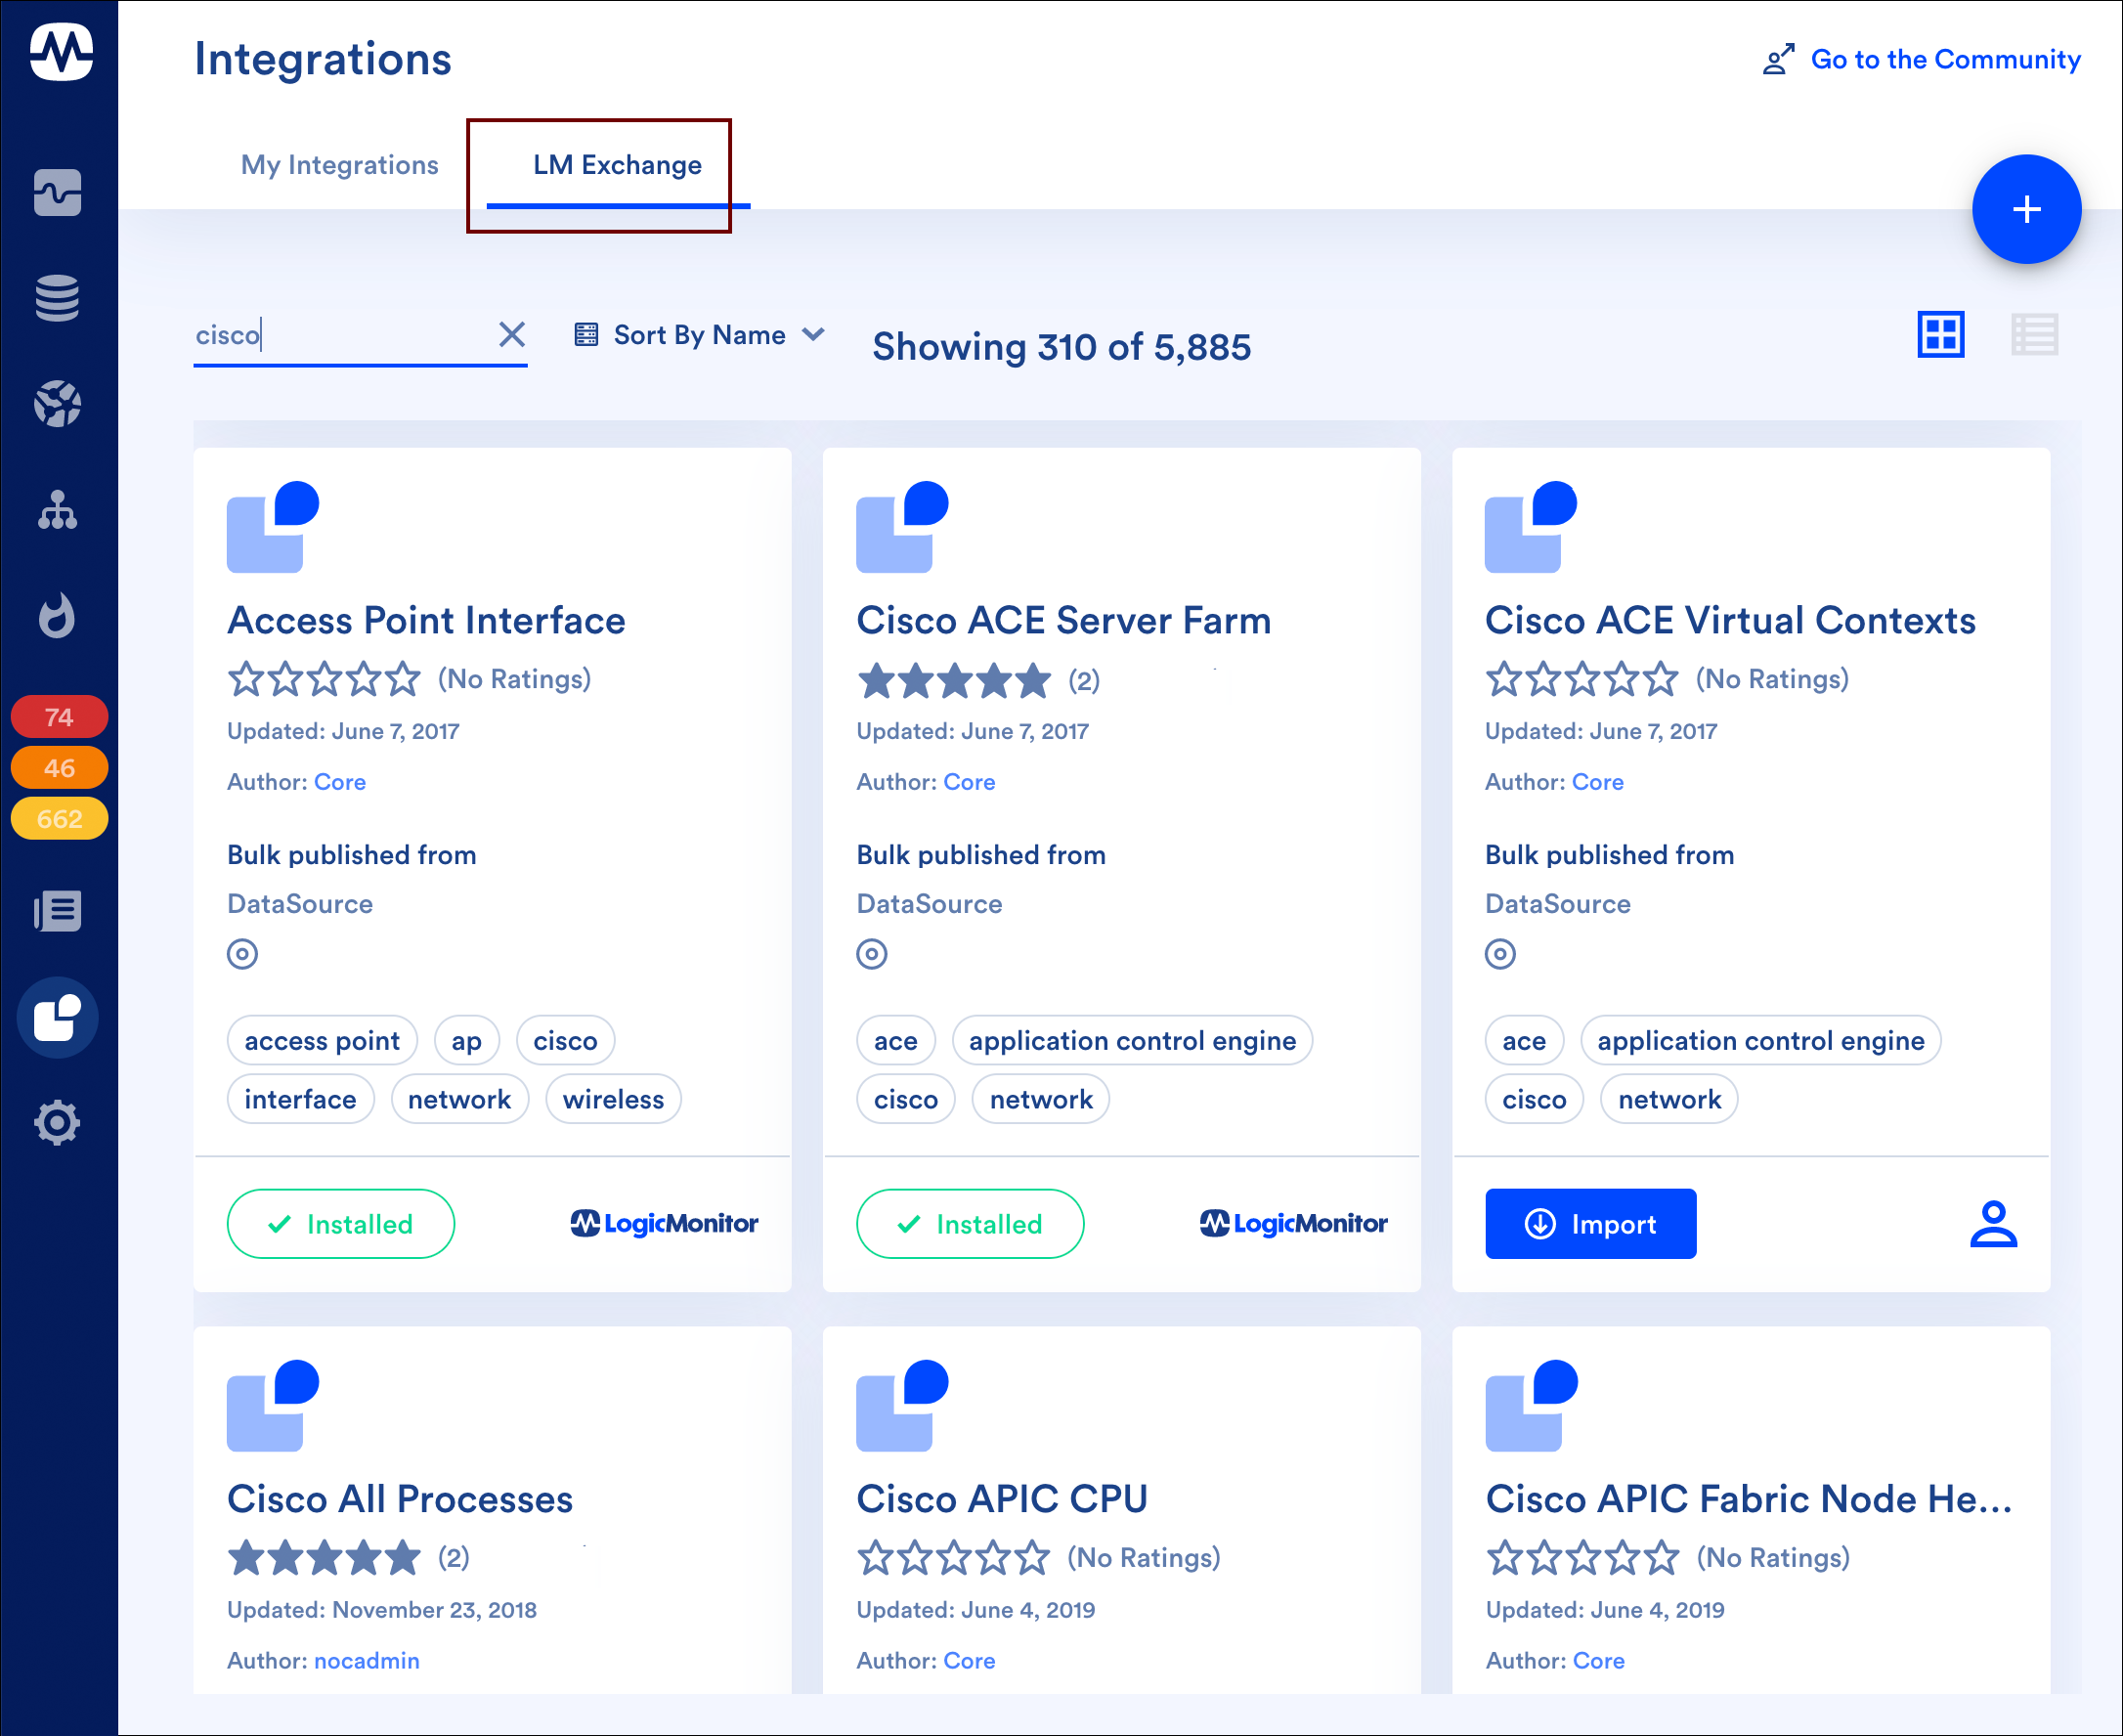
▲ The new Integrations page brings the LogicMonitor repository right into the platform. Using the LM Exchange tab, you can easily browse, search, and import new and updated LogicModules—whether published by LogicMonitor or by a member of the LogicMonitor user community. (UI image captured from alpha version; subject to change.)