
v.74 Release: Alert Forecasting, Custom Reports, & Dashboard Navigation
Last updated on 14 September, 2022This release is a fun one – in as much as updates to your monitoring system can be fun. It includes the expected minor improvements and bug fixes, as well as some big changes to forecasting, reporting, and dashboards.
Note – Alert Forecasting and Custom Reporting functionality will be available for all packages during the introductory period.
Alert Forecasting
We introduced the Table Widget a few releases back, which is a nice way to compare metrics across similar devices. We also introduced the ability to forecast a single datapoint a few months ago, which can be useful in determining the severity of an issue or in planning for the next budget cycle. We have combined them to bring you the best of both worlds, an at a glance view of current – and future – datapoint performance.
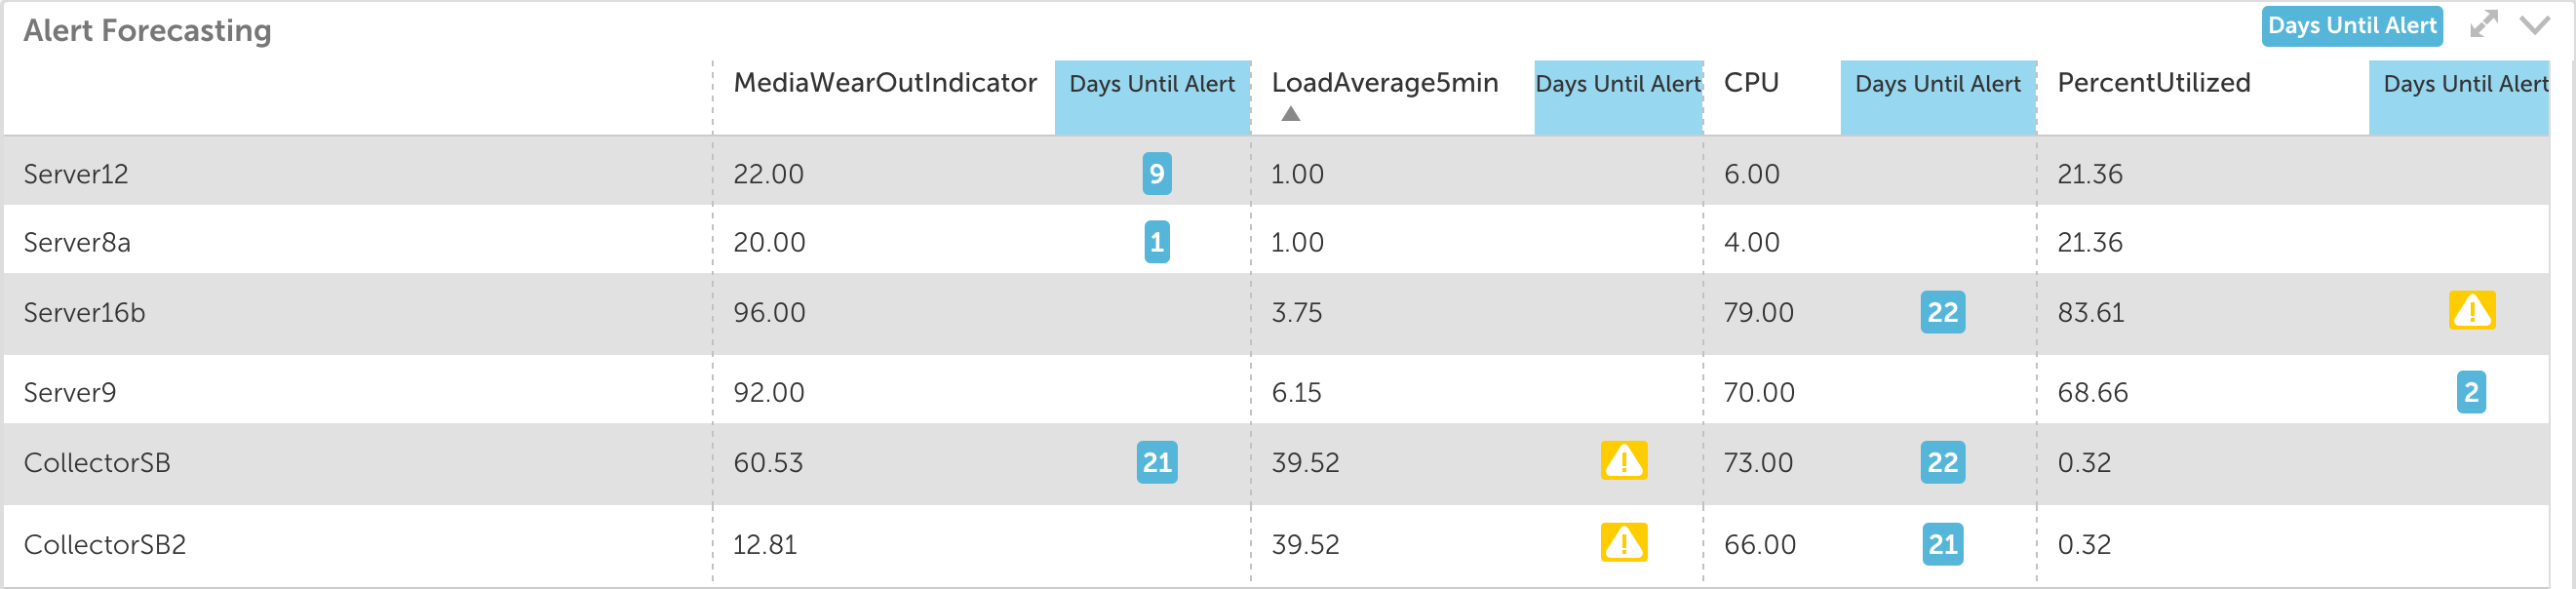
Forecasting can be enabled by column and results in a days until alert value in the table. If the datapoint is in alert, or is expected to reach an alert threshold within the next 30 days, a day value will display. Whether it’s a quick hit list of where you need to focus your attention at the start of a day, or a means to review planning information with your customers, it will take some of the guesswork out of managing your infrastructure.
Configuration options include the training data range, minimum severity, and confidence levels. More information is available here.
Custom Reporting 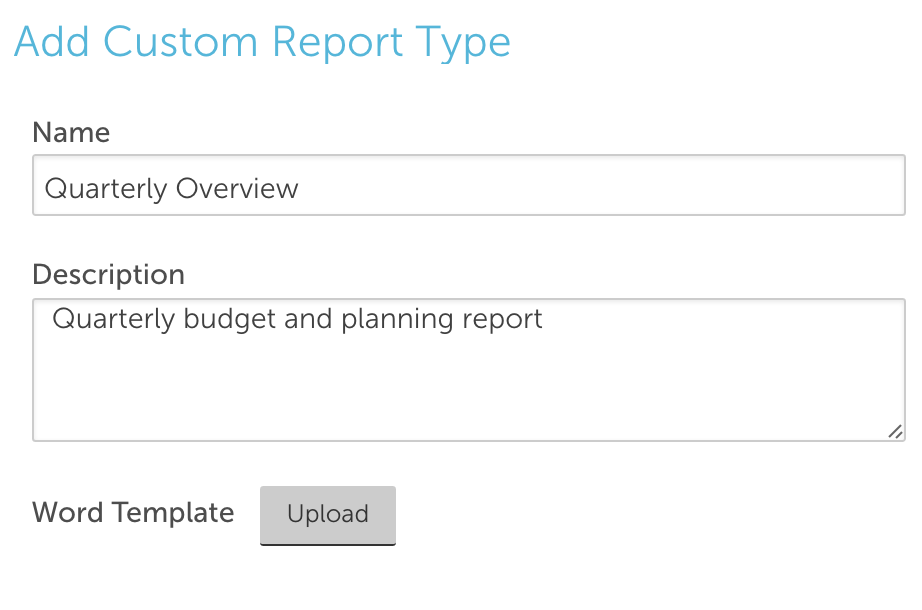
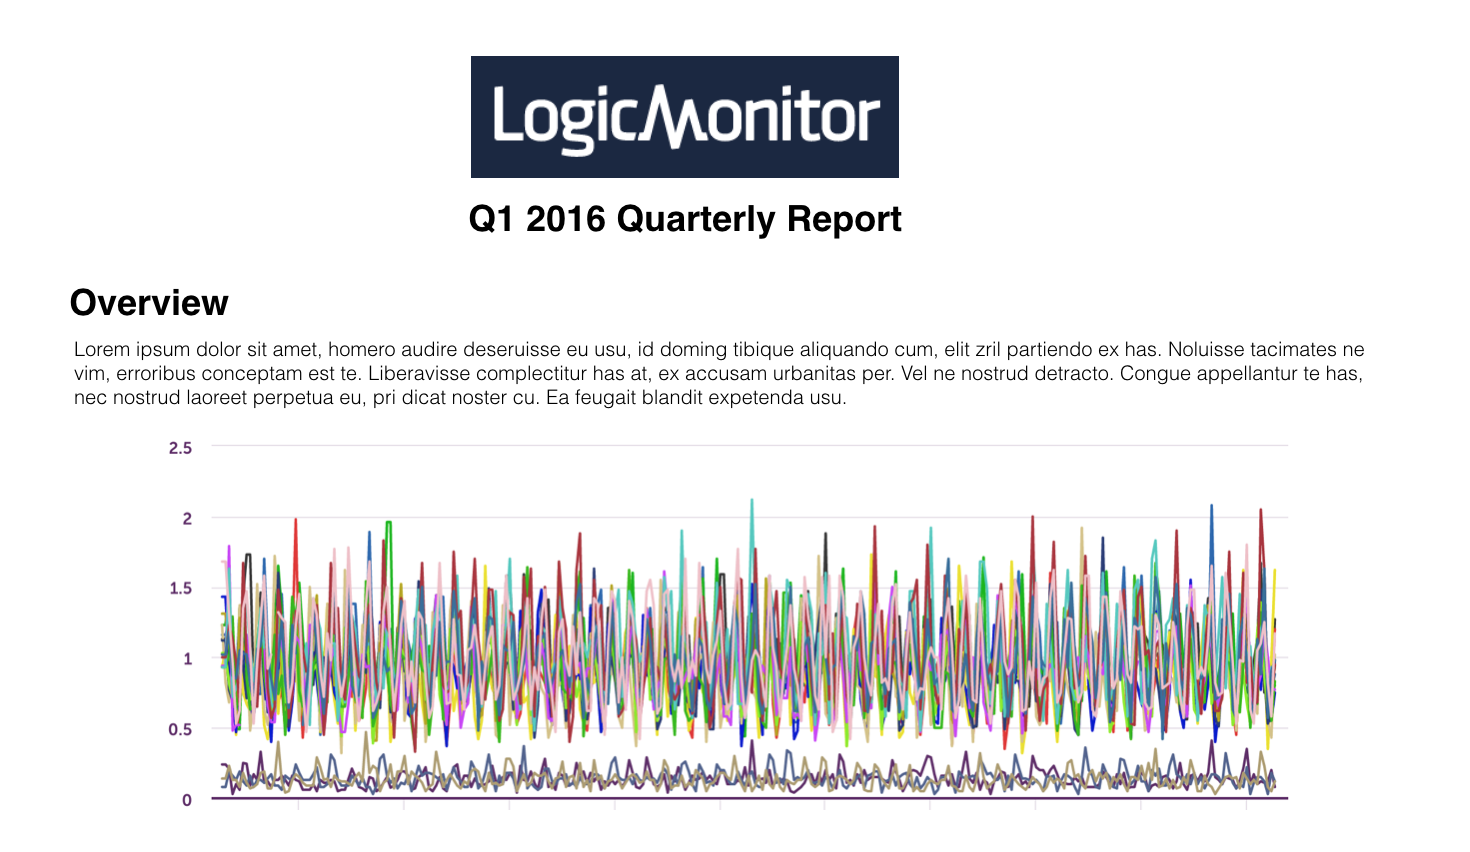
We have always offered a number of highly configurable report templates, and while they provide access to a wide breadth of data it isn’t always exactly the data needed for your specific report. With the release, you are able to create a report in Word with any number of report variables, images, and other contextual information. Just upload it to LogicMonitor, and generate it for any number of time frames, device groups, or specific devices that you may need.
Check out our in depth documentation to get started, and please let us know what other report variables you’d like to see made available.
Report Data Update
When available, all reports now read from our granular s (TSDB) storage engine. This means SLA reports are more accurate than ever. Time to give them another try!
Dashboard Navigation
We’re working our way through a list of the dashboard improvements necessary to allow us to turn off the old view. While there are still a few load time optimizations in the works, we made notable improvements to the management element.
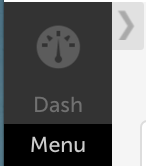
To start, you’ll notice the word Menu in the left nav when you are on the dashboard page. If clicked, it will open to display your dashboard management panel. The arrow will also open the management panel.
When expanded, the management panel separates your dashboards into favorites, public, and private dashboards, with the ability to search for a dashboard in any group.
A dashboard can be added to the favorites group at any time by clicking the star next to the name in the list or in the header:

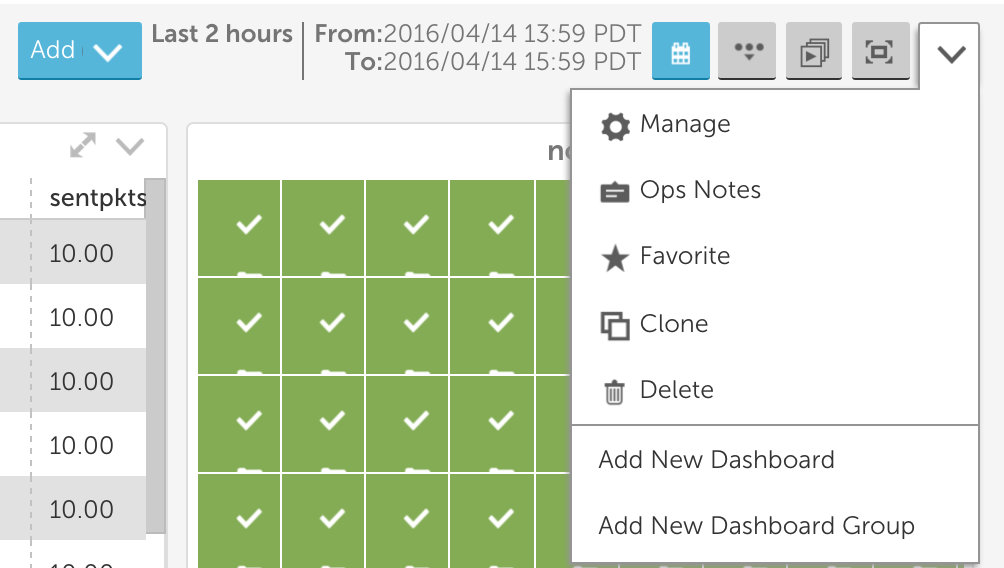
While the cog allows you to manage any dashboard, including changing status from public to private (or vice versa), cloning, editing the dashboard name, or deleting the dashboard entirely.
Along with management improvements, we updated the header to consolidate functions and call out the time range:
There’s more in the works, but we always love to hear what you’re hoping for – send us a note via the feedback button at the bottom right of your account.
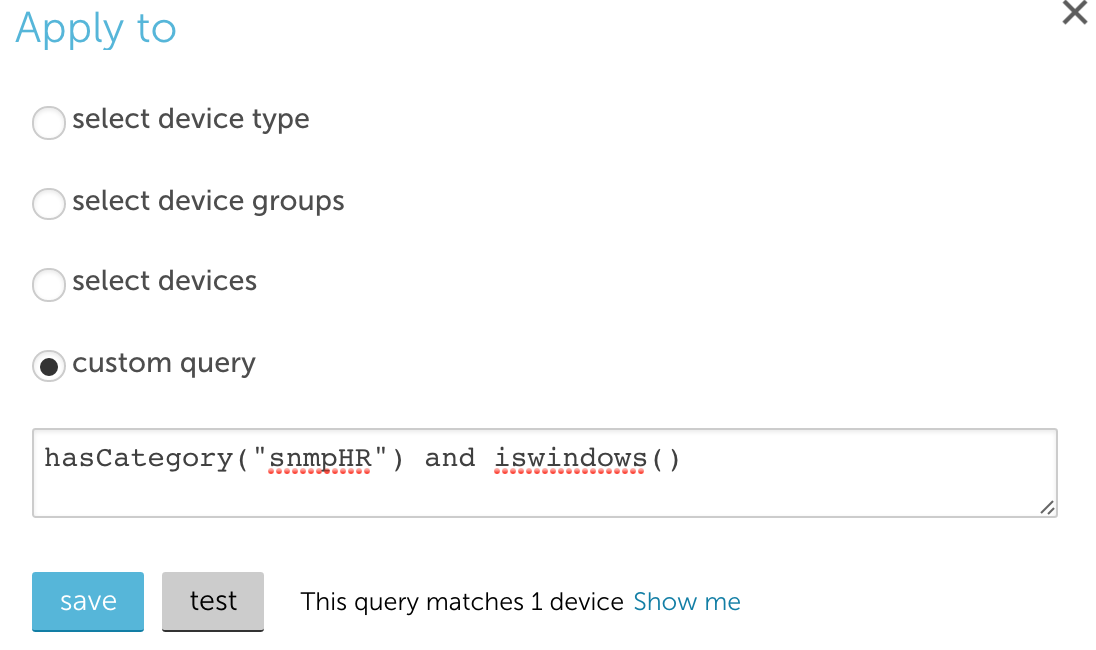
Test Option for Applies To Changes
Changing datasources can be intimidating, a small applies to change can result in instances automatically being removed. To help assuage any anxiety, there’s now a Test option that will display all instances that will be added or removed due to a change. On click, the test option displays the number of devices the applies to matches.
Clicking Show me will display details of all affected devices:
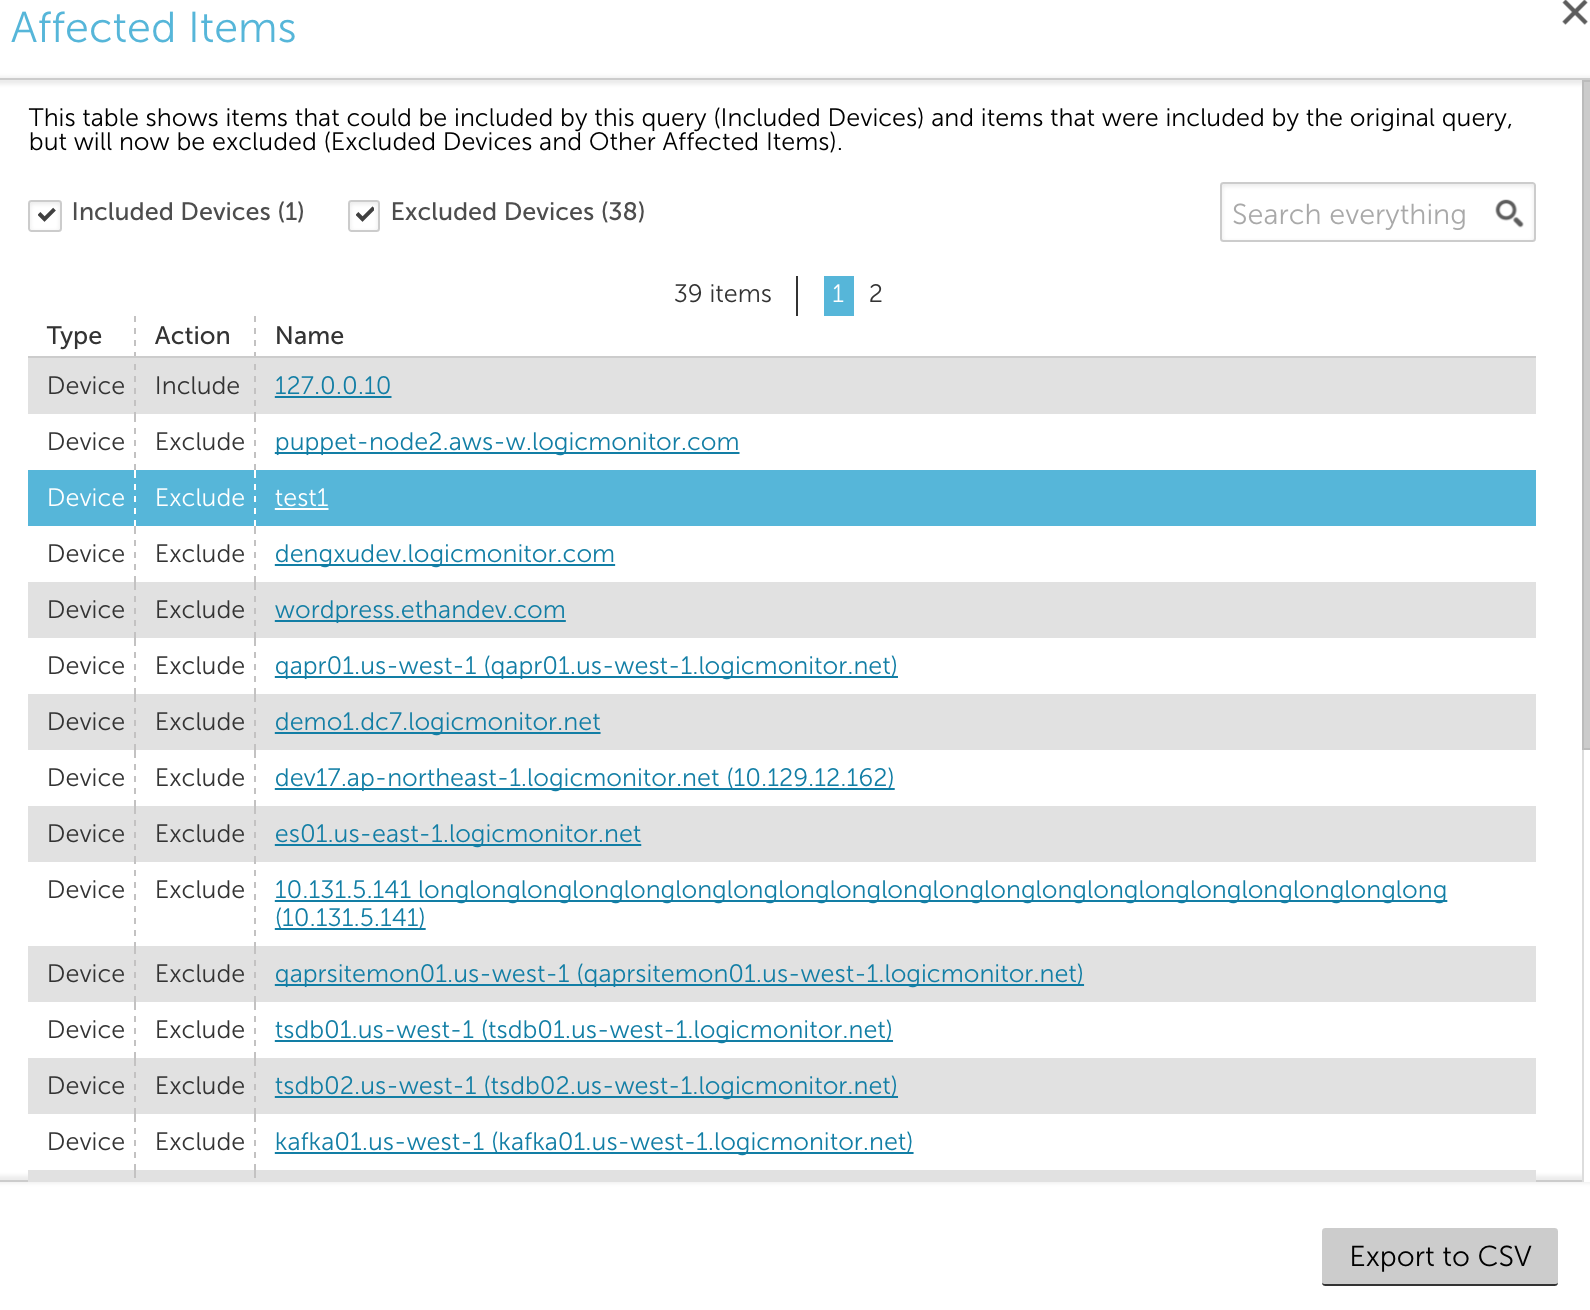
It is currently only available
when using the Applies To wizard when editing datasources.
Other Improvements:
- Acknowledgement alert notification messages sent to integrations now match the standard email acknowledgment alert notification message.
- Collector down, collector failover/failback and throttle alerts can now be sent to Integrations if the integration contact method is included in the collector down escalation chain.
- The severity column in the alerts table can now be the short or long form.
 or
or - A new token, ##EXTERNALTICKETID##, is available for message templates. If an alert is associated with multiple tickets across different integration platforms, a list of ids and associated platforms will be displayed. If an alert doesn’t have an associated external ticket id yet (e.g. if it was just triggered) ##EXTERNALTICKETID## will display as 0.
- The token ##END## is available for alert cleared messages and will include the cleared date and time.
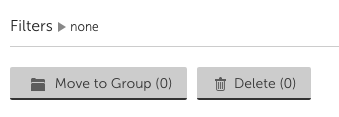
- Ability to select multiple devices from the Netscan unmonitored group and move or delete on click. Previously only drag and drop was available.
- Optimizations added in determining when to display the Chat with Engineer button, ensuring it accurately reflects engineer availability.
- When viewing a widget in the expanded view, zooming to change time range will also update the time displayed in the widget title
- Updated the netscan exclude logic. Previously distinct include settings were evaluated with priority. This has been reversed, distinct exclude clauses will trump all include logic.
- Emphasis has been added to items where the highest severity alert is acknowledged or SDT’ed.
- Ungrouped Instances of multi instance datasources display the first 100 in alphabetical order with the option for See More.
- A new function, rawpercentile, is available for use in graphs, widgets and virtual datapoints. This expression uses raw data to compute percent values, in contrast to the percent function which uses aggregated data. Rawpercent has also been added to the list of reserved terms for datapoints.
- Pinning a netflow widget to a dashboard preserves direction and interface filters.
- A new icon is available in the Google Map widget if the device referenced is dead.
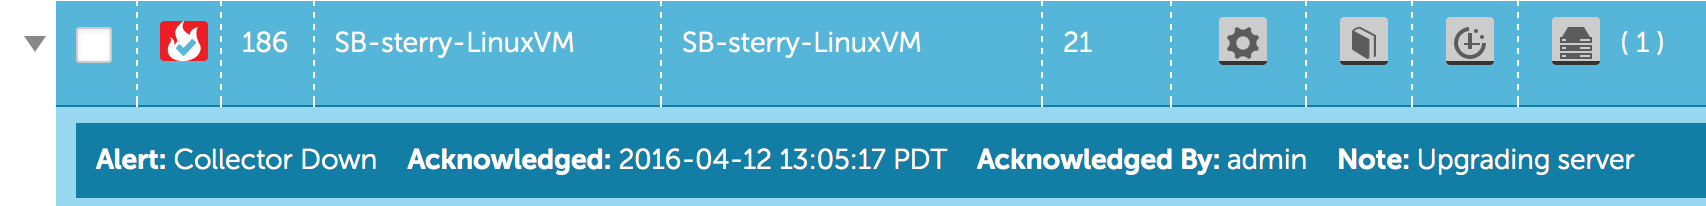
- Collector alert acknowledged details are available in the expanded row view of the collector table.
- When searching or filtering reports we now display (x of y reports) next to the group name, where x is the number of matching reports and y is the total (e.g. 1 of 4 reports).
- Testing locations and steps while configuring a service check has been improved to avoid timeouts and delays.
- The dashboard name field on the widget configuration has been changed to a text input, allowing for names to be pasted and for suggested results to display.
- Access log entries have been improved to include more helpful and consistent information when netscan policies are added, updated, executed and deleted.
- Device properties will display in alphabetical order in the manage window when opened. During the editing process, new properties will still display first.
- Additional obfuscation has been applied to sensitive Services properties, aligning with Device property management.
- Alerting enabled / disabled toggle has been color coded, providing an easier at a glance view of alerting status.
- A search box has been added when viewing collector events.
- We’ve updated how we handle adding, updating and deleting Service Groups. If you try to delete a service group that contains sub-groups or services, we now display a prompt asking if you want to delete the group or the group and all services within the group (similar to device groups). Additionally, we no longer allow a service group to be dragged into one of its sub-groups.
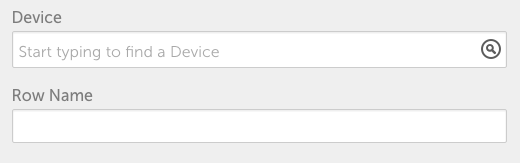
- A custom name can be added for table widget rows. It will default to device name, but can be edited to provide an alias or abbreviated name.
- AWS EC2 Container Services (ECS) is now supported. Note that ECS monitoring requires a new datasource – this datasource is not yet available, but will be added to our core repository soon
- Status of cluster alerts is included in determining the highest severity alert for a group.
- Mobile: Improvement to display of graphs when quickly switching between landscape and portrait.
- We now send you an email if SMS alert message delivery fails because our number was blacklisted.
- Multi instance datasources have always allowed you to enable or disable alerting for all listed instances. This functionality is now available for enabling monitoring.
- Templates are available for collector failback alerts (available in Settings | Alert Messages), allowing for inclusion of custom information. The invalid response information has also been removed.
- When a user i
s deleted from an account, we also remove that user from the recipient list of any reports they are set to receive. - Improved session based authentication, including addition of a CSRF prevention filter for internal api calls.


Please note: Since the initial release of v.74, we have encountered issues specifically with ADFS and CSRF. These will be addressed in a v.74 point release.
Bugs Fixed:
- The ##COLLECTORID## and ##COLLECTORDESC## tokens weren’t being populated correctly for custom HTTP delivery methods.
- When testing alert delivery for custom email delivery methods that contained tokens in the recipient field, we previously displayed a response message with tokens. We now replace the tokens in the response message with the appropriate content, so you know who the test alert was sent to.
- Manually running forcing device match for datasources resulted in an error for a subset of users.
- If a threshold was not formatted correctly in the old UI, such as =1 in lieu of = 1, the datapoint could not be edited in the new ui view.
- OpsNotes added for a past date that were prior to daylight savings time were displaying an hour off (for example, added for 6pm and displaying as 7pm).
- The new configuration for netscan script policies allows for a default group, if no other group was assigned. This can now be set to the primary (root) account.
- Datasources with spaces in the name could not be saved. We now accept spaces in datasource names, as long as the space is not the first or last character.
- Testing Services was occasionally failing due to timeouts at some locations.
- When adding a device, collector group and preferred collector input boxes defaulted to the expanded view. This is now triggered by clicking on the input box.
- Unable to change report page display from list to tile view in ie11.
- Users with permission to edit only personal information were unable to save changes.
- Intermittent error displayed when viewing collectors page due to background requests.
- Previously, once a collector was downloaded it could be added as a preferred collector even if it the installation did not complete. This is now forbidden.
- Group level SDTs for one datasource were sometimes incorrectly applying to devices that weren’t associated with the datasource.
- Instance graphs that had graph items of both area and stack types were not displaying correctly.
- Service Ping Average Round Trip Time graphs couldn’t be added to dashboards.
- Suppressing alert clears for a Collector was suppressing all alerts for all devices monitored by that collector. Suppressing alerts clears for a collector now only suppresses collector alert clears.
- Alerts for No Data were not clearing correctly for Datasources with 1 hour polling intervals.
- Cluster alerts configured to trigger based on a percentage of datasource instances in alert were sometimes triggering when the percentage hadn’t been met. This was due to an issue with how we determined the total number of instances, and has been corrected.
- If you used a glob expression in the format of a(a|b) or !(a|b) in a widget, we automatically updated it to include an extra set of parenthesis. This did not affect the entities matched by the glob expression. Nonetheless, we’ve updated how we interpret and parse glob expressions to avoid adding these extra parenthesis.
- When editing escalation chains there was a significant delay in displaying the user list if the account had 100s of users and many integrations.
- If the same device was discovered and added twice to the unmonitored group via Netscan, each time by a different collector, only one of those unmonitored devices could be added in to monitoring.
- Edits to user roles that spanned multiple pages were not saved correctly.
- Device NOC Widgets grouped by datasource were displaying NOC items for datasources without any instances.
- Multiple EC2 instances with the same device displayname tag were resulting in errors on the EC2 – Device and CloudWatch device dashboard.
- If a HTML widget contained an iFrame with a redirect it could cause the full dashboard to redirect.
- Dragging an item up the tree did not cause the tree to scroll up. Making it possible to only drag and drop an item within the viewable tree items.
- The account name previously displayed in the Group column on the Alerts page for alerts associated with devices only in the root group. We no longer display any group name in the Group column for alerts that are associated with ungrouped devices.
- The Enable DB Discovery checkbox in the MongoDB- datasource was always being saved as checked, even if left un-checked when the datasource was saved.
- Graph definition not available for overview graphs from the graph drop down.
- Properties containing a ‘-‘ were causing an error when used in Applies To fields.
- Datasource definition was not displaying next to edit global definition for single instance datasources.
- AWS subgroups and service subgroups could not be changed to be a primary group.
- Sub-groups couldn’t be added to dynamic groups – this has been corrected. Note that sub-groups underneath a dynamic group automatically add devices based only on their own inclusion criteria, and not based on parent group inclusion criteria.