
v.77 Release: Internal Service Checks, Alert Forecasting Report, SDT History
Last updated on 14 September, 2022The v.77 release brings a few more much anticipated features, and we’re just warming up. Check out the new Internal Service Checks (collector based services) and Alert Forecasting report, both valuable ways to keep you one step ahead of potential issues. There are a lot of other good nuggets in this one, so be sure to give the details a scan.
Sunsetting the Old UI
We mention this almost every release, because we know our entire purpose is to help you avoid surprises. The old Dashboard page is going to linger for one more release, but will be formally removed with v.78. The Devices page will follow, be sure to check out some tips on why the new view is more helpful. Finally, use the feedback button – we want this transition to be positive for all, so let us know how we can help.
New Features
Internal Service Checks
Internal service checks, or collector based checks, bring you all of the functionality of our standard Service checks direct from your collector. It’s great to know if the rest of the world can reach your website, but you likely only really care if your end users can reach your cloud services or internal applications. Internal service checks allow you to run these checks directly from your data centers, or wherever you have a collector installed.
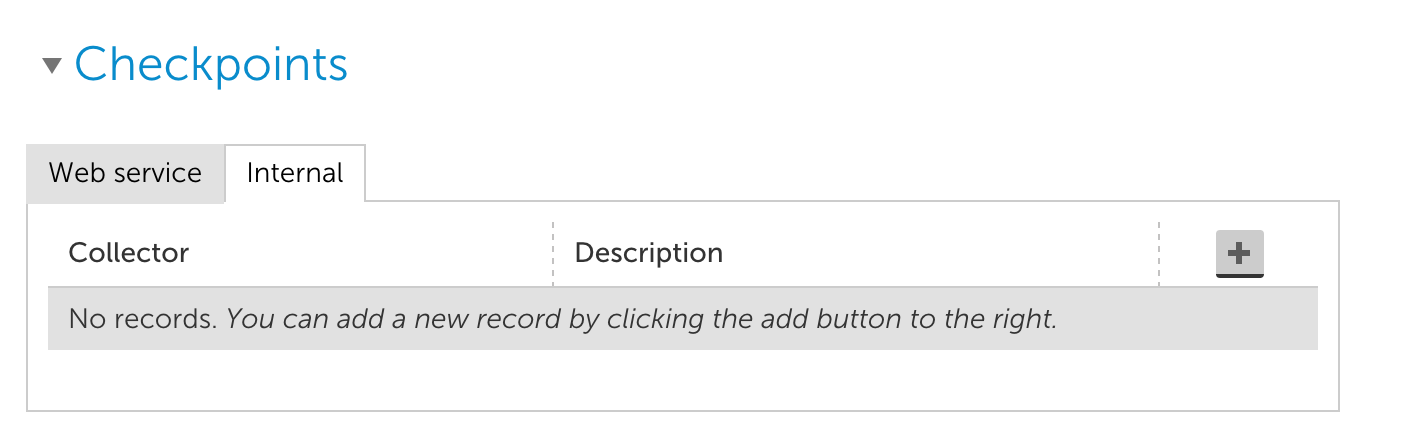
How does this differ from the HTTP Web Page checks you’re currently running, you ask? Great question. The underlying functionality is the same, but usability and configuration is significantly easier. You can add a Ping or Website check from the Services page just by clicking Add, and selecting Internal Website Check or Internal Ping Check.
Configuration is exactly the same as standard Services checks, with the exception of needing to add a collector (version 22.050 or higher):
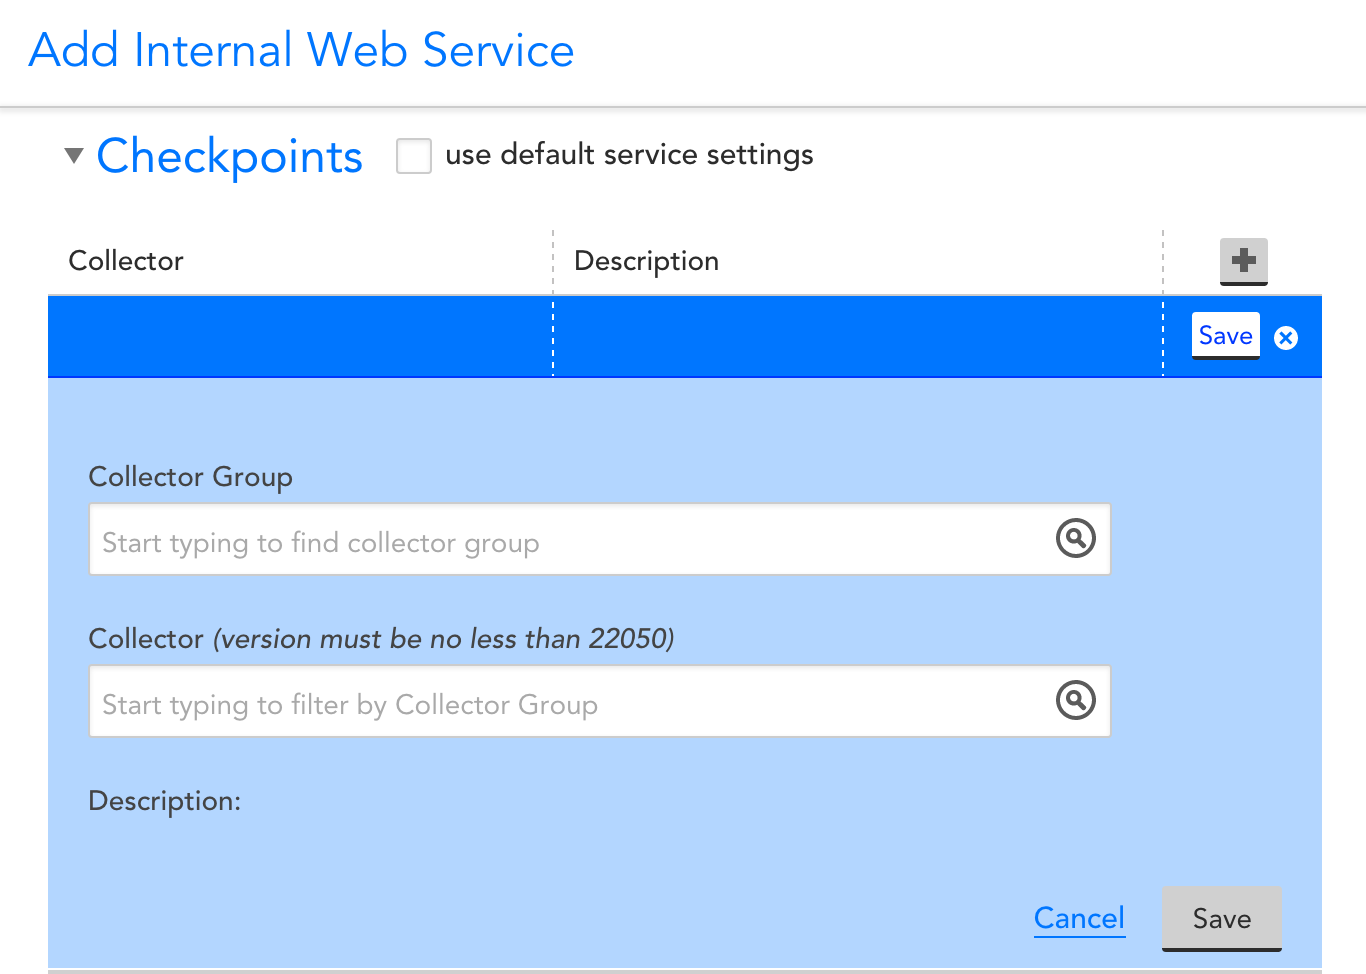
You can run a check from as many, or as few, collectors as you desire, and can configure alerting based on individual or overall performance.
Service Defaults can also be used for your checkpoint locations and alert triggering, just add your primary service collectors in the Services Defaults window:
We recommend setting up service checks for all of your internal applications and creating a published dashboard so you can proactively let your end users know if the service is having an issue. We have some other features in the works, but use the feedback button to let us know what would be most useful to you.
Alert Forecasting Report
We introduced Alert Forecasting as a function of the table widget. This is great for troublesome equipment, devices where the table widget view is also necessary, or situations where less than 100 datapoints suffices. The Alert Forecasting Report allows you to extend that functionality, with a higher limit on datapoints and the ability to set up a few monthly reports as a routine checkin opposed to the daily widget view.
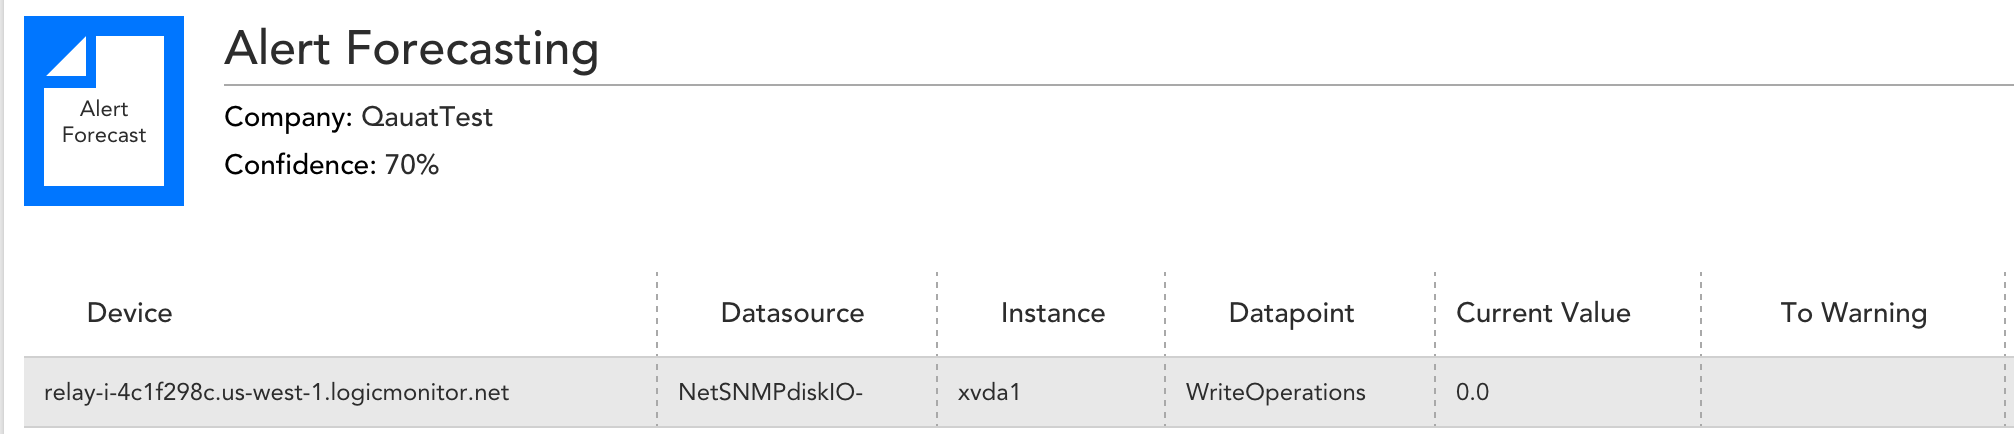
To give the report a try, select Alert Forecast Report from the Reports | Add | Add Reports menu. As with the widget, you can configure the training data (which past performance to base the forecast on), Minimum Confidence, and datapoints to include. You can also configure which columns, order, and can sort in the HTML view. See more details here.
Scheduled Downtime History
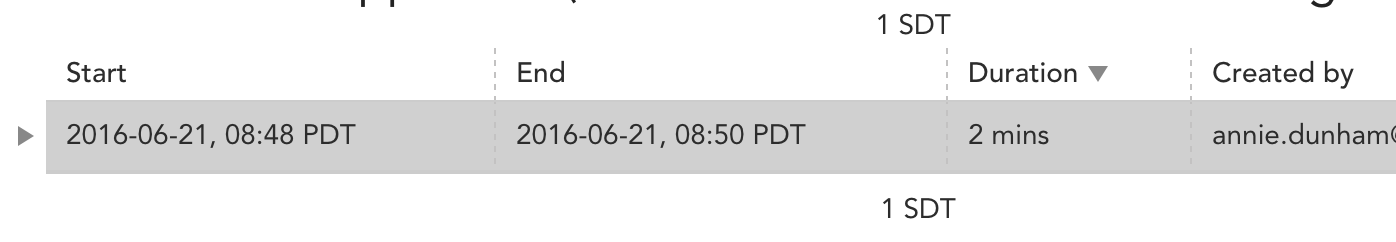
A historical view of Scheduled Downtime (SDT) is now available at the level the SDT was set. For example, a SDT set at group “Servers” will apply to all members of the servers group at the time it was run, and will be visible in the SDT tab History section for Servers.
Collector Management
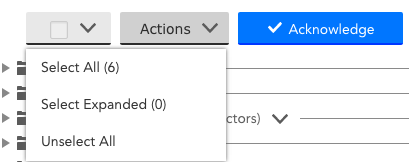
We’ve streamlined collector management a bit. You can now select all collectors, or select all viewable collectors, from the toolbar:
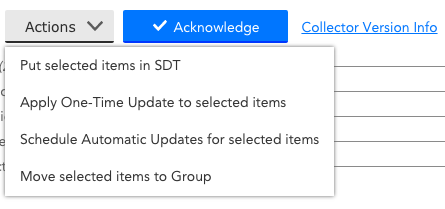
Once selected, you can use the actions dropdown to set scheduled down time, schedule updates, or move collectors:
Other Improvements:
- Devices:
- Instance Groups: We have added a new default Instance Group (Unmonitored). If monitoring is disabled for an instance, this group will be created. Monitoring can be disabled for any instance by dragging it to the group, or enabled by dragging it out of the group and into an active instance group.
- @disabled datasources now displays as Disabled Datasources group, and displays as the last item in the list.
- When a Netscan Policy discovers unique devices with duplicate names, those devices will now be added with display names set to IP_CollectorID.
- Improved alpha numeric sort for instance names in device tree and instance groups.
- Extended obfuscation to apply to: .password, .pass, .auth, .key
- Alerts:
- Clear alerts are sent to integrations when alerting is disabled.
- Alerts table – last updated time. While we refresh every minute, a browser or network issue can cause this to be delayed. The last updated time gives you confidence you are viewing the most recent alerts.
- Alternating row color – Some of you love the alternating grey and white row colors, and it drives some of you crazy. Now it’s your choice, in the Alerts table | Settings, alternating row color can be disabled.
- Settings:
- Account Information:
- Account payment information includes last updated time.
- Invoices display in date order.
- Datasources:
- Exporting a datasource to XML previously included any embedded script code, but excluded the code if it was an external script file. Exported datasources in XML format now include all script code, embedded and external.
- When editing a datasource or datasource graph, the Add Graph and Add Overview g
raph buttons are persistent allowing for easier navigation. - Datapoint description field extended to support 1024 characters.
- For Windows EventSources, we’ve changed how we map event severities to allow for Critical events (previously, we didn’t map higher than error).
- Collector debug history is preserved.
- Account Information:
- REST API:
- You can now manage Reports via our REST API.
- Other:
- The Applies To ‘Test’ option was incorrectly displaying matching results based on inherited device properties, which was misleading. LMS expressions are only evaluated against properties of the device itself, not inherited properties.
Bugs Fixed:
- Dashboards and Widgets:
- Alert Widget was not scrolling as expected.
- Group field not preserved in alert table forecasting widget.
- Dashboard exits faux full screen mode on refresh.
- In the Pie Chart widget, specific color selections for slices are no longer deleted if an item is edited.
- When adding a slideshow, the dashboard auto complete list could scroll off the page.
- Devices:
- If SNMP was enabled for Linux Hosted XenServers after they were initially added to LogicMonitor, Active Discovery for SNMP related properties weren’t automatically triggered. While manually running Active Discovery did solve the issue, we’ve modified our Active Discovery logic slightly to better accommodate for this scenario in the future.
- Dynamic groups based on the collector properties were not refreshing correctly.
- Instance level SDTs were displaying in the device header. The SDT summary should only display inherited or applied SDTs, not children.
- Alerts
- In some cases, datapoints with alert clear intervals set to 0 weren’t clearing until 2 datapoint values satisfied the threshold.
- In some cases, the Alerts Table was displaying infinite values where it should have displayed No Data.
- Other
- Resetting a user’s password would result in the admin needing to resign in.
- Users who were forced to change their password received an invalid wrong password error.
- The Charge column of the Invoice information displayed in the Account Information | Financial section previously displayed the payment amount. This column now displays the full invoice amount.
- Minor Display fixes:
- Drop down arrow for AWS properties was indicating the table was expanded when it was still collapsed.
- Sorting alert table by severity selected all checkboxes.
- Reenabled search by alert ID for alert table.
- Corrected a chrome retina display issue, where the use of the overflow tag could result in unnecessary empty space.
- Minor improvements to wording of error messages, such as the message displayed when trying to manually add a device to a dynamic group.
- Minor cleanup to the threshold edit window.