
v.95 Release: Dashboard Improvements and LogicMonitor for HipChat
Last updated on 14 September, 2022The v.95 release is a big one! You will notice this release has a couple major themes encompassing tons of awesome improvements, namely involving Dashboards and our new LogicMonitor for HipChat integration.
We will be rolling out the v.95 release through mid-October.
Dashboard Improvements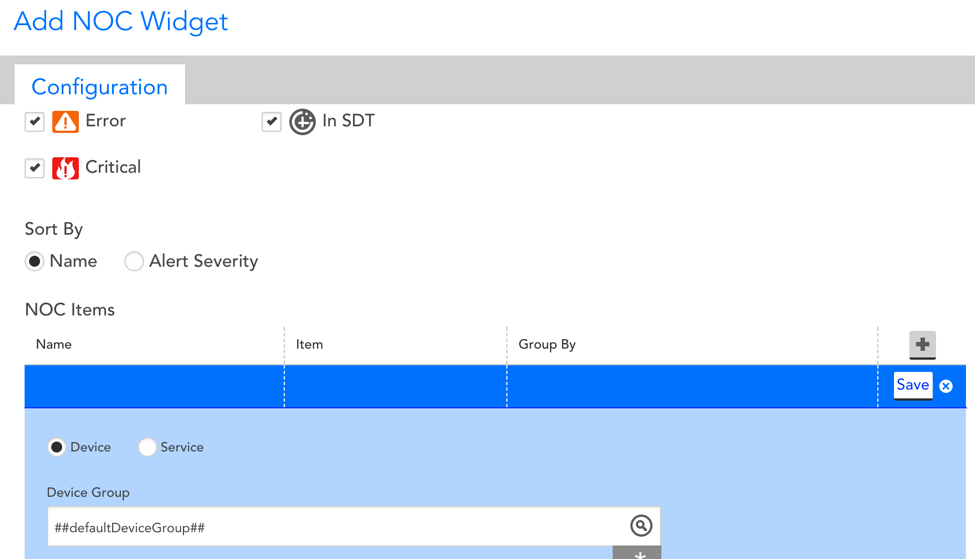
As you can see, we have been hard at work making myriad improvements to our Dashboards! These are all part of a major Dashboard usability initiative…stay tuned for more information. Changes you will see in this release include:
- We have combined Devices and Services into a single NOC widget. This is a huge improvement that enables at-a-glance insight into your device/service groups’ health from a single, centralized view
- The NOC widget can now be viewed as either a table (default) or a list. Choose your preference in the configuration dialog
- Added support for Google Map themes! Customize your Map widgets using the new styling options: Standard, Silver, Retro, Dark, Night, and Aubergine
- The Alert Widget now supports tokens for filtering alerts. Like other widgets, you can set the “Group” field to the defaultDeviceGroup token and modify the displayed data simply by changing the tokens’ values at the Dashboard level
- Empty widgets have a new look! We improved the icon display when widgets do not have data to show, and cleaned up the error messages.
- In the Table Widget, we have added the ability to sort by the Device Name column
- Added pagination functionality to the Table Widget so you can choose how many results to display per page
- Improved the format of the Widget configuration window
- Widgets will automatically be added to the Dashboard you are viewing. You no longer need to specify the Dashboard!
- Added the ability to clone Widgets directly from their dropdown menu
- To avoid errors, Dashboard Groups cannot contain special characters in their name
HipChat Integration
v.95 coincides with the release of our brand new HipChat integration! LogicMonitor for HipChat lets you receive and respond to LogicMonitor alerts directly from your everyday chat tool. Check out some of the other things you can do with LogicMonitor for HipChat:
View Alert Details
- View the full alert message information from the sidebar of your HipChat room
- View all requisite DataSource/Service Graphs directly within HipChat
Acknowledge Alerts
- Acknowledge alerts directly from the Detailed Alert View. Our HipChat integration can dynamically retrieve your username, so all you have to do is click a button
Schedule Downtime
- Respond quickly with a 1 hour Scheduled Downtime, giving you time to investigate the issue
Other Improvements
Collector
- You can now change the preferred Collector for 1000+ devices at a time without error
Devices
- Improved title wording of Netflow graphs displaying total traffic
- Improved display of properties and monitored services on the Info Tab for AWS groups
Integrations
- The default unique key in the PagerDuty integration used to identify the external record was updated to “incident_key” from “id” to provide full functionality out of the box
Mobile
- Searching the Dashboard tree on the mobile application would previously only display results from the root group. We have improved this to show all search results regardless of parent group
Settings
- Easier file upload for customizing your Company Logo. Simply drag-and-drop files to upload
Bugs Fixed
- Device URL showed on both group and device (instead of just device)
- In some cases, graph lines would change colors upon zoom making it difficult to identify the line of interest. This has been improved so that lines maintain their original color
- Downstream fields were cleared when editing a datapoint in the custom graph and NOC widgets
- Scheduling Reports occasionally resulted in a “schedule invalid” error when switching from Monthly to Weekly schedules
- Some Custom Graph Widgets incorrectly displayed ‘No active instances’
- Scheduling reports without access to set alert levels on included devices resulted in an error
LogicModule Releases
Below is a list of improved LogicModules that were implemented since our last release:
Monitoring Improvements:
- Nimble Array Info: adjustment to total volume usage percent
- Windows CPU: adjusted polling interval to better represent CPU utilization
- Cisco Fan: fixed alert message
- Linux Filesystem Usage: fixed issue where long mount/device names would wrap lines and not be discovered
- Email Round Trip: added additional exception handling logic