
v.73 Release: Netscan overhaul, Threshold management, and much more
Last updated on 08 December, 2022v.73 brings more much awaited functionality. Although it has some dependencies, such as a collector upgrade for Netscan, we think you’ll be happy with what you see.
Netscan Improvements
While Netscan has been available for some time, the configuration has been limited. The new Netscan features fall into three categories:
Policy configuration:
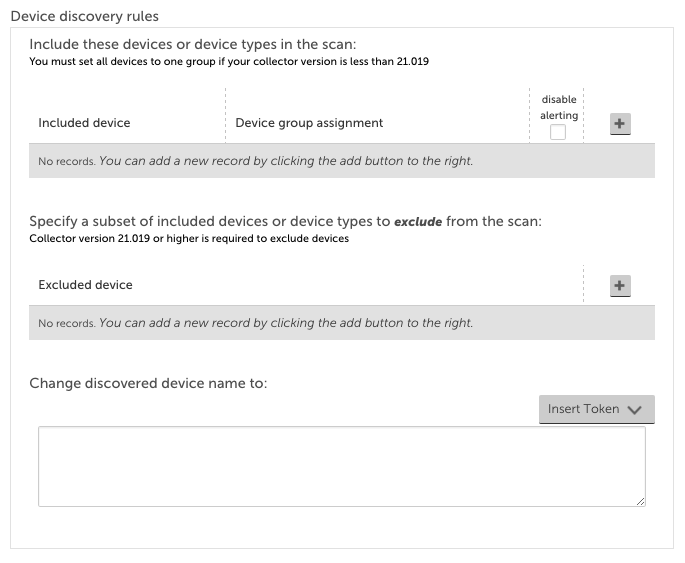
- Exclude IP ranges from the scan
- Use credentials from an existing group, or assign custom credentials for the scan
- Group assignment based on device properties
- Exclude devices based on device properties
- Customize the device name based on tokens and text
Scan Overviews:
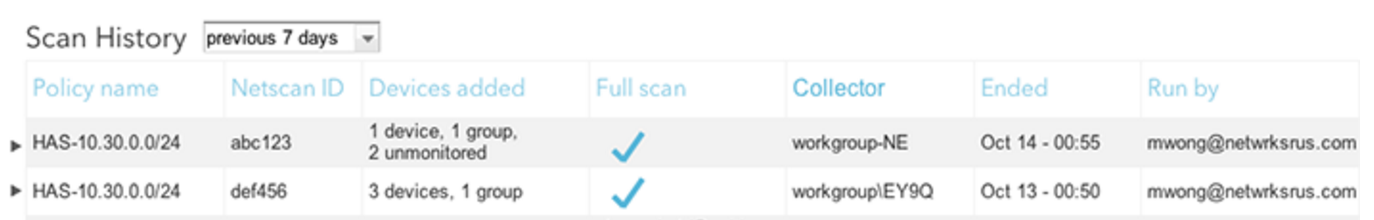
- See active, upcoming and historical scans.
- Review devices added per scan.
Managing Unmonitored Devices:
Devices that are discovered but not added to a group can be easily filtered, sorted, and dragged into groups, to help quickly get them monitored in the right place.
To take advantage of these features, you will need EA collector 21.019 or higher.
Note: To support the new functionality, existing netscan policies have been converted to one policy per schedule.
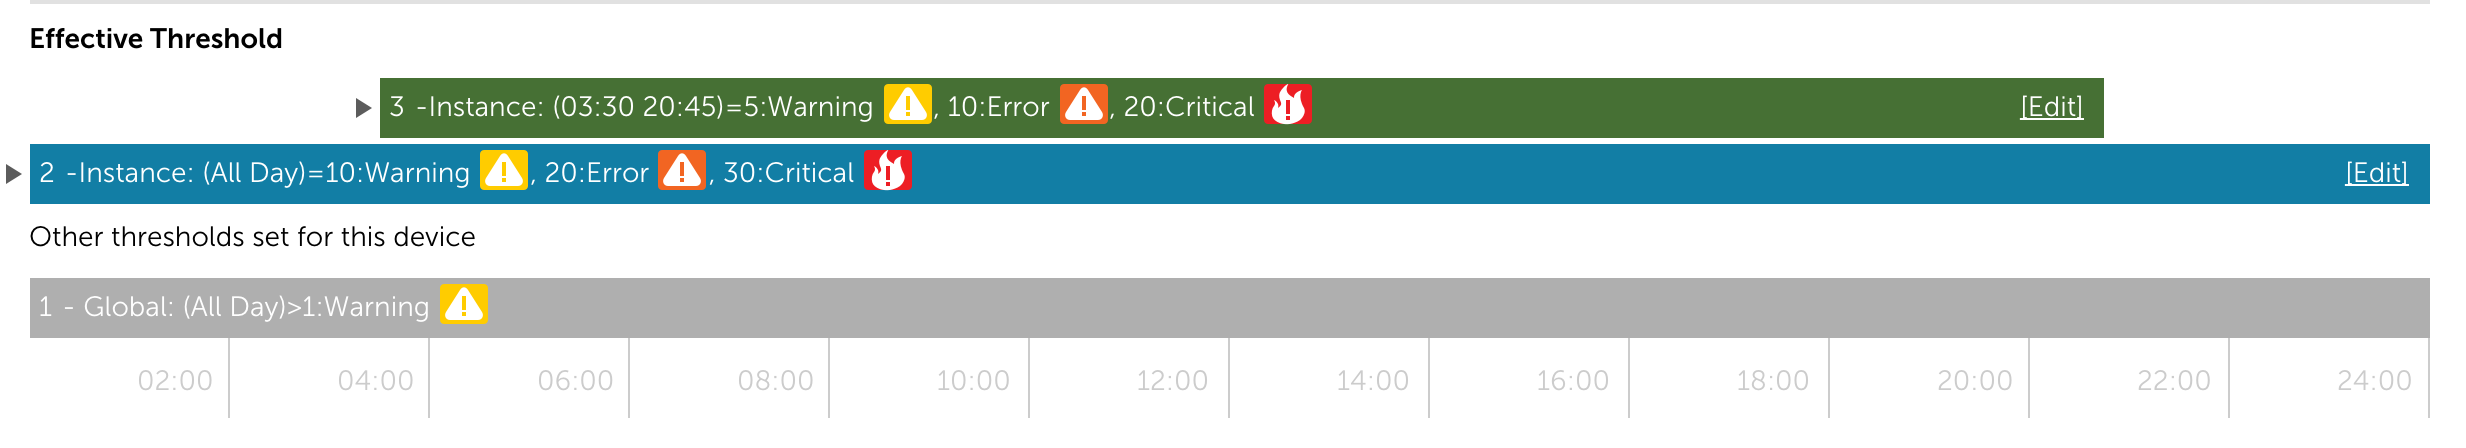
Thresholds
Alert thresholds have always been highly customizable, but at times it has been tricky to determine which threshold would take effect. The latest set of improvements are designed to provide an at a glance view of which thresholds will be in effect, and to make it easy to navigate between threshold levels.
Google Map Widget
The Google Map Widget configuration was updated to make it easier to select device groups, devices, or all members of a device group. Just in time, as the new widget pins now also provide more information about device or group status.
New AWS Region and Service
This release includes support for the AWS Seoul region (ap-northeast-2) and Lambda. Note that Lambda monitoring requires a new datasource – this datasource is not yet available, but will be added to our core repository soon.
Services Testing Locations – IP updates
There have been updates made to the Services Testing Location IPs in DC, Dublin and Singapore regions. Details can be found here, and the changes will take effect for your account with the v.73 release.
Other Improvements:
- We’ve improved our glob support to allow for more complex glob expressions. One of the more notable additions is the ability to construct a multiple exclude glob filter using !() (e.g. server!(2|4) will match everything that contains ‘server’ and that doesn’t contain a 2 or 4). See our detailed documentation for more information.
- You can sort by any column when viewing HTML reports.
- The navigation tree for Settings | Datasources has been updated to make it faster to find what you need.
- Ability to test an alert from an integration configuration. The test alert displays what is returned by the alert recipient / tool, which is useful when confirming receipt and how ticket information is formatted.
- You have always been able to hide tabs in the left nav via the user. This is also now based on the role permissions. If no manage or view rights exist, the option will not display.
- When deleting a datasource, the confirmation will include a count of devices affected as well as a link to the full list.
- Alerts can be acknowledged directly from the alert widget configuration screen.
- HTTP PUT requests are now allowed in custom HTTP integrations
- When adding a new collector, the OS will default based on browser information.
- Updates to the layout of the filter table in eventsources.
- A variety of new fields have been added to the Datasource screen, such as Search Tags, to support upcoming enhancements.
- Updated error for the google map widget when no location properties are assigned to the included devices or device groups and for custom graphs if no matching instances are found.
- These fabulous release notes can also be accessed via a link in the footer.
- Added the ability to view raw data directly from the device dashboard for single instances.
- The AWS resources that are automatically discovered can be limited based on tags. The header for these tags has been updated to say “Restrict discovery to the following tags” to more clearly explain how the tags will function.
- Properties are now grouped by system properties (set via the collector) or custom (editable).
- Hyphens are no longer supported in graph datapoint names to avoid conflicts in virtual datapoint calculations.
- Detailed error message displayed if a timeout is encountered when trying to add Linux or Windows Processes or Services.
- The ##ALERTSTATUS## token previously reported alert status as either active or clear. It now reports active, clear, ack, update or test.
- Because a Windows Collector is required to collect data from Windows servers, we now display a warning message if you set a Linux Collector as the failover collector for a Windows Collector.
- Instance descriptions have been added to widget names when datasource instance graphs are pinned to a dashboard.
- Updated the look of our payment pages.
- Alert Reports configured to display more than 4000 alerts were failing to generate in PDF format. We now email PDF Alert Reports if they contain 2000-4000 alerts, and we display an error message indicating that filters should be added or the format should be changed if more than 4000 alerts are included.
Bugs Fixed:
- Users could not update the name of a gauge widget, an
d could experience a blank widget on refresh. - The active discovery filter ‘NotExist’ no longer requires a value.
- The mobile alerts page did not respect the Alert View Permissions set on the user level.
- A user signed in with Single Sign On would receive an unnecessary Save button and confirmation when viewing the Single Sign On settings.
- If group is used as a filter in the device search,( ie: g:group1 d:dev1), returned devices will reflect the associated group.
- Opsnotes were added based on the time of the local machine instead of the account.
- The Advanced custom graph widget always reverted back to Top 10 for datapoint lines.
- Adding a property to a device caused the manage dialog to refresh to the top of the page. It now stays focused on the properties section.
- Removed a variety of unnecessary confirmation popups.
- Update to Alert Table filters. Selecting cleared alerts previously applied a time based filter that could exclude the most recent alerts.
- When cloning a windows event log eventsource, suppress duplicates was selected regardless of the original configuration.
- Auto refresh of the alerts table would cause the alert detail page to close, which could lose note detail. The alert detail page now persists when the page refreshes.
- Access log limited to 30 days even when 60 days were available.
- The system.collector property wasn’t working in LMS expressions (used in Applies To fields). This has been fixed.
- We no longer prepend the device and datasource name to custom legends for the Simple Custom Graph Widget. Advanced Custom Graph Widgets still display this information, as they are intended to display data across multiple devices and/or datasources.
- ServiceNow company names that contain special characters (e.g. trademark symbol) were not displaying correctly in the integration configuration.
- Testing alert routing from the Alert Tuning Tab didn’t always work for Integrations that were only configured to send requests for new alerts (and not configured to send update requests for that alert).
- Corrected a typo in the Slack Integration alert data for clear requests.
- Updates to AWS groups with a large number of monitored resources were sometimes taking several minutes. We’ve corrected how we handle these updates.
- Users without manage permissions to all Services couldn’t see alerts for Services that were only in the top level group.
- Corrected an issue with the Alert Threshold Report which affected display of some custom thresholds.
- Devices didn’t always inherit the correct group thresholds when they were drag n’ dropped into the group.