
v.76 Release: Text widget, ‘Faux’ Full Screen mode, Audit Log report
Last updated on 14 September, 2022The v76 release will be rolled out the first two weeks of June. There are a lot of useful features in this one, most notably the Text Widget and Audit Log report.
You will notice the toggle for the old Settings page has been removed. The toggle for Dashboards is set to be removed in v.77, please use the feedback button to tell us about any reasons you still use the old view.
Add Widget Updates & Text Widget
The first thing you will notice when you go to try out the new text widget is that the Add Widget process has changed from a long text list to a more helpful summary display:
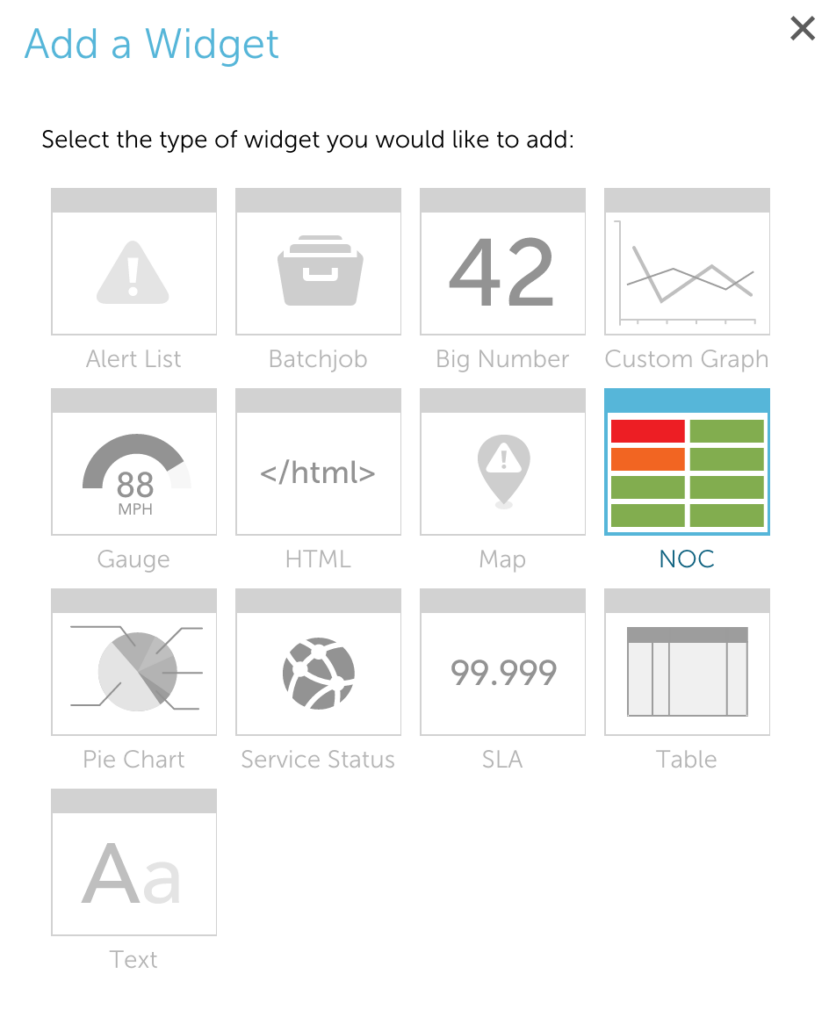
Aside from this just being more colorful, you’ll notice:
- The Simple and Advanced Custom Graph widgets have been merged into one.
- The Service and Device widgets are stills separate configurations, but are set as part of the NOC widget config.
- Services status can still be graphed by Individual or Overall status, but is also a part of the widget config.
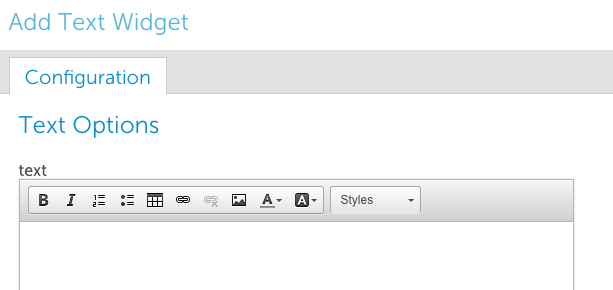
Last, but not least, the Text Widget. With the Text widget you can insert any HTML or image into your dashboard. Great for giving your front line staff a to do list, keeping team members updated on other happenings, or including images of your datacenter cage – or customer’s logos.
‘Faux’ Full Screen Mode
A number of you run our dashboards on a big screen somewhere in your NOC, support center, or other area of your operations. We love this! But the browsers love it less, and kick you out after ~24 hours. Since we can’t convince the browsers to change, we’re introducing ‘Faux’ Full Screen mode. This will:
- Replace the old full screen mode.

- Keep the browser in non full screen state, so that it won’t reset.
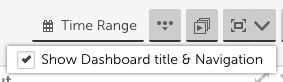
- Hide the left navigation bar. It can also hide the Dashboard title if you click the down arrow and uncheck show title.
- Fit graphs to the 3 x 3 (or 6 x 6) grid.
- Mimic the old full screen mode if you expand your browser window and hide the tool bars.
We have hidden the old full screen mode, as this solution seems to better solve most needs. If you miss it, let us know via the feedback button.
Audit Log Report
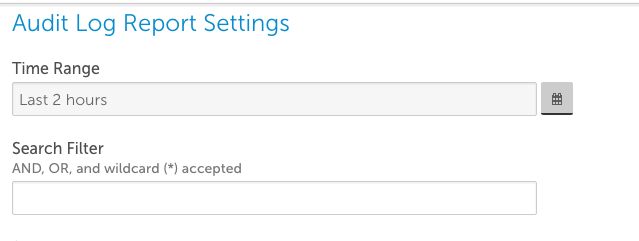
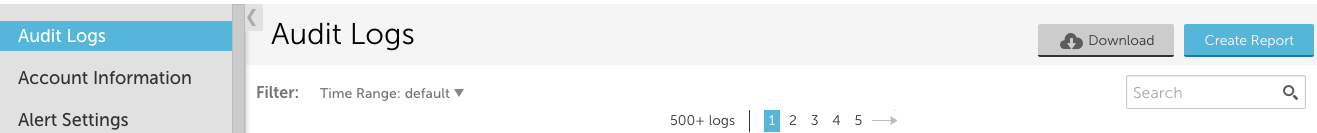
Although we only store Audit Log information for 60 days, we’ve made it easier to store specific information as long as you wish with the Audit Log report. Simply go to Reports | Add a report, select Audit Log and schedule the report to be sent as frequently as you wish. The search filter in the report behaves exactly as the Search box in the Audit Logs page:
For those of you paying close attention, we did rename the Settings | Access Logs to Audit Logs. It’s a more representative title for the information that is available. You can also create an Audit Log report, or download search results, directly from the Audit Logs page:
End User License Agreement (EULA)
A new roles setting is available that will require users to accept the end user license agreement.
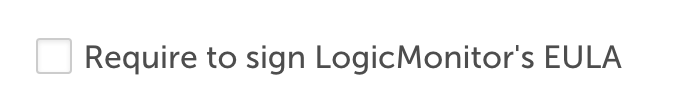
The setting is configured per role, but stored per user. Once a user has accepted the terms they will not be shown the EULA again – unless the LogicMonitor terms change.
NetScan Updates
The old Netscan policies were limited in their configuration, and as a result never discovered duplicate IPs even if they were monitored by different collectors. The new Netscan policies can support duplicate IPs (as long as they are on different collectors), but that’s not always what’s needed. As a result, a new configuration is available for Netscan:
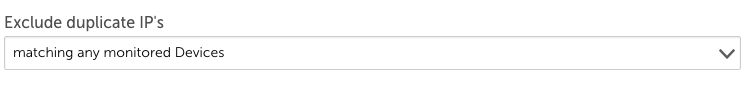
In the case you’ve moved devices off of the collector associated with the policy, or you never have duplicate IPs, you can tell us when to consider an IP as invalid. Your options include:
- matching any monitored devices (anything already in this account)
- anything previously discovered by this policy
- matching devices in any of these groups (configurable list)
- matching devices assigned to these collectors (configurable list)
Existing policies will default to matching any monitored devices, as this was the previous behavior.
Improvements:
- REST API
- We’ve published our Widgets resource, enabling you to programmatically get, add, update and delete your dashboard widgets.
- The ability to export datasources to XML format via our REST API is available.
- Published REST API calls are now called out in the Audit Log, along with the API Token Access Id that made the request.
- General
- We’ve optimized the amount of time it takes to update AWS accounts with a large number of monitored resources.
- Users without view dashboard permissions will automatically default to the first tab for which they have view permissions.
- When responding SDT to native SMS alert notifications, you can now include a decimal to SDT the alert for a fraction of an hour. For example, SDT .1 will create an SDT for 6 minutes. This is consistent with how the SDT response already works for email and SMS email alert notifications.
- Collectors
- Collector group selector for managing devices and netscan policies changed to a lookup field, and is no longer required.
- Improved collector group selection to account for over 50 collector groups.
- In collector management, the option has been added to exclude the device hosting the collector from failover. This will preserve collector metrics. See documentation for more details.
- Dashboards
- More optimizations added for rendering speed. Specific improvements for dashboards w
ith the alert widget
- More optimizations added for rendering speed. Specific improvements for dashboards w
- Devices
- Enable / Disable monitoring and alerting for Instances update
- Added a 400 ms delay to drag and drop to avoid accidentally moving devices or instances in the tree.
- If over 100 instance groups exist and an instance search returns an instance from group 101+. clicking the breadcrumb will display the first 100 instance groups, the see more option, and the selected instance.
- Changes to the columns in the device alerts table will be reflected throughout the device page.
- Integrations
- The AutoTask Integration now supports configuration item assignment for tickets.
To assign a configuration item to a ticket if that device triggers an alert, set a host property “autotask.configitemid” and add the token ##autotask.configitemid## between the </Description> and </Entity> tags in all existing Autotask Integration HTTP Delivery payloads for each alert status. If you create a new autotask integration after this release, it will already have this token. - When an alert downgrades in severity and the new severity is not included in the original alert rule, we now send an alert clear notification to that original alert rule. This is useful if you don’t have all alert severities routed to the same integration, because it allows for tickets to be closed when an alert’s severity downgrades out of a rule.
- The AutoTask Integration now supports configuration item assignment for tickets.
- Mobile
- The big number widget is available in mobile dashboards.
- Mobile users using Single Sign On can now remain logged in. An administrator can change the SSO Configuration to allow mobile users to stay signed in for X days.
- Netflow
- Table data will be updated based on the time range or the selected range in a graph.
- Data vs. Pie view was stored across dashboards. It’s now a per widget, per dashboard setting.
- Netscan
- Ability to configure which devices to exclude in the scan (assigned to other groups, collectors, anywhere in account.) Previously Netscan could not add any duplicate IPs, regardless of collector. Existing policies have been updated to exclude any duplicates to maintain this functionality.
- Reports:
- We’ve introduced a new option for Device Metric Trends reports, One graph per Instance, which is useful for viewing all datapoints from one instance together in one graph.
- Email recipients is not a required field for scheduled reports. This will support an upcoming enhancement to allow for a report to be embedded in a dashboard.
- Settings
- Multiple groups can be selected when adding an alert rule
- Applies To test functionality is available from the Datasource Applies To wizard, displaying a link to a list of devices that will be added or removed when Applies To is changed.
- Minor
- Minor cleanup to the threshold edit window.
- When adding a device via the device wizard, any snmp.community string credentials are obfuscated.
- Payment page no longer opens up in a second browser window.
- Cleaned up the Full Path Column for Services on the Alerts Page.
Bugs Fixed:
- Dashboards / Widgets
- Google Map widget could not be created or edited in IE 11.
- Adding graphs to & removing graphs from device dashboards wasn’t recorded in the Audit Log. Both actions are now clearly logged.
- Selecting ‘Add Alternate’ in a Table Widget column and then removing the Alternate Datasource didn’t remove the Suggested Results from the screen.
- Netscan
- When a Netscan policy was cloned, the configuration to assign all devices to the unmonitored group was not passed to the new policy.
- Adding multiple devices from the Unmonitored Netscan Devices group into a monitored group resulted in a single collector being assigned to all devices. Now, all devices moved from the Unmonitored Netscan Devices group into monitoring will always be associated with the collectors that originally discovered the devices. If the collector that discovered a device has been removed from the account, we will prompt you to select a new one.
- Other
- Corrected the displayed collection method for old NetApp datasources from API to Performance Data.
- Selecting a report link displayed the report, but minimizing that report row did not close the report.
- During collector upgrades, the current time was displayed in place of the start time on the Updates tab. Active upgrades now display an accurate start time.
- If a datasource was saved with an invalid attribute in the old UI, it couldn’t be viewed in the new UI.