
The pressure is on for organizations to innovate faster, respond to market changes better, and work smarter. To power the continuous delivery and agility they need for DevOps, companies of all sizes, in every industry, are embracing the cloud. In a recent survey, 92 percent of participants were using multiple cloud vendors.
Although cloud solutions offer great advantages, many organizations are still keeping key services and apps on-premises due to cost, security, compliance, and other concerns. They are adopting containerized applications that can run both on-premises and in the cloud as a unifying layer.
Tapping the Full Benefits of Containers
Running applications in containers at scale in hybrid cloud environments is complicated. It requires managing multiple clusters of containers and ensuring the right workloads are running in the right places. For this reason, most organizations that use containers also employ an orchestration tool like Kubernetes.
With Kubernetes, organizations need insight into the performance of their applications that are running in containers, as well as the health of the underlying Kubernetes resources and orchestrating components. To get the most out of their deployment, this insight should be presented alongside the organization’s existing monitored hybrid infrastructure in a single platform.
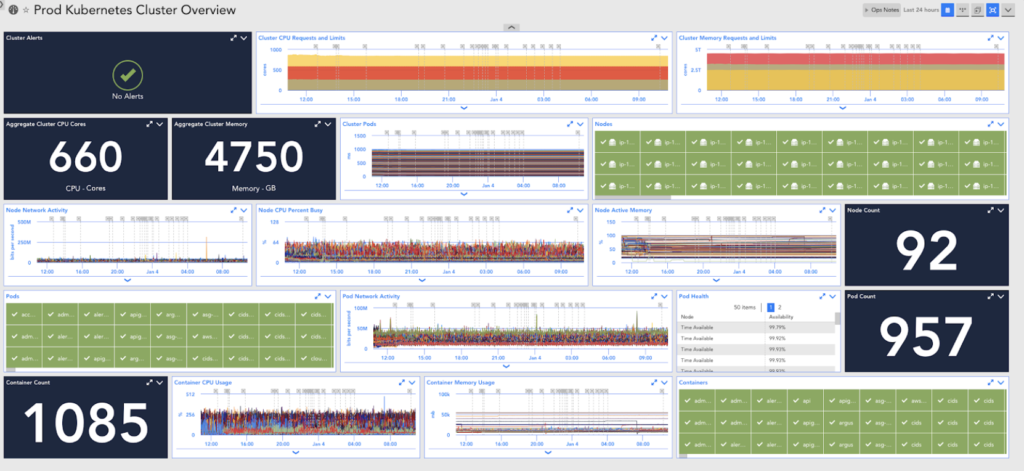
Tip #1: Kubernetes follows a master-worker, node-based cluster architecture. Monitoring these nodes, as well as the Kubernetes pods and containers that run on these nodes, can provide insight into the underlying infrastructure for applications running in Kubernetes.
Monitoring Kubernetes Nodes
The Kubernetes master schedules workloads across worker nodes, which can be physical servers or virtual machines, depending on the environment. In addition to traditional key server and VM metrics, organizations should monitor the allocatable CPU and memory for each node, and the CPU and memory limits (i.e. required resources) and requests (i.e. requested resources) for the node. Monitoring these metrics can help identify where cluster resources and applications can be optimized.
Monitoring Kubernetes Pods
The fundamental unit in Kubernetes is a pod, which runs on a Kubernetes node and is made up of one or more containers. Monitoring a pod to understand whether or not it is ready and passing health checks, how much CPU and memory it is using, and its network throughput can provide insight into the general health of the cluster.
Monitoring Containers
Monitoring a pod can also provide information about its containers. The containers in a pod are units of work that collectively serve an end goal. Obtaining metrics such as container CPU usage, memory usage, and restart count can help with the identification of root causes and performance bottlenecks. Additionally, organizations should be monitoring and alerting on key metrics that are specific to the applications running in their containers.
Now You See It…Now You Don’t
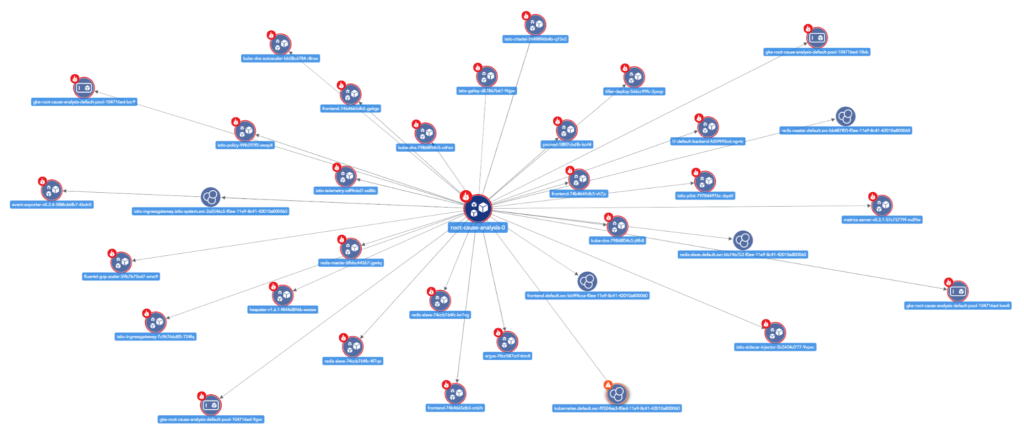
Kubernetes containers and pods are ephemeral resources. It’s difficult to monitor a component that may appear (and disappear) quickly and unpredictably. It’s also challenging to ensure that they are added and removed from monitoring in a timely manner. Traditional discovery systems that depend on checking for new resources periodically may not capture changes quickly enough.
Tip #2: To accurately track ephemeral resources, use event-based discovery, where cluster resources are automatically added and removed from monitoring based on Kubernetes events.
What’s Happening Where?
It’s not always easy to determine the overall health and performance of services and applications when underlying resources are ephemeral.
Tip #3: Logically group together resources supporting a common service or application and monitor aggregate key performance indicators for the service or application as a whole, instead of focusing on the individual ephemeral instances.
It’s Time for a Better Approach to Monitoring
It’s clear that today’s hybrid cloud environments and innovative container technologies create new challenges for IT. But with the right approach to monitoring, organizations can gain the visibility and insight they need to maintain the health and performance of their most critical apps and services. Sign up for a free 14 day trial. Let us show you how to get started.