
Simple Network Management Protocol (SNMP) provides a standard message format that devices being monitored and monitoring systems can all speak – even though they will be running different operating systems. SNMP is the most widely deployed management protocol; it is simple to understand (although not always to use), and enjoys ubiquitous support.
The following eBook helps to decode SNMP and the three commonly used versions, defines common acronyms used, and teaches the best practices of configuring and monitoring SNMP.
What is SNMP?
SNMP stands for Simple Network Management Protocol. In real life, it is often not simple; does not only apply to network devices; and often cannot be used for management of devices, only monitoring. It is definitely a protocol, however.
SNMP stands for Simple Network Management Protocol. SNMP provides a standard message format that devices being monitored and monitoring systems can all speak – even though they will be running different operating systems.
SNMP is mainly used for the collection of data about devices, such as CPU load, memory usage, etc. SNMP is supported on practically all network equipment (switches, routers, load balancers, for example), but also on most server operating systems, some storage devices, and even some server application software. However, the extent of what “supporting” SNMP really means can vary wildly, but more on that later.
If you’re reading this, you are probably responsible for the performance, availability and capacity of some IT infrastructure. (If you are reading this because you thought it was the complete guide to the State of New Mexico Police – this is not for you.) If you have a nontrivial (i.e. greater than zero) amount of IT infrastructure whose availability matters – because it generates revenue or enables others to do their jobs – then you need a way to be sure your infrastructure is working, and working well. If you want to sleep, you need an alternative to staying up all night watching the output of the command line tool top to watch the processes on your server. Especially if you have 1000 servers and 100 routers.
The standard way to solve this is to run a monitoring system, which queries the servers, routers, switches, and other devices, asks them how they are doing, and generates alerts (which you can receive via email, text, or voice call) if any of them report they are not doing well. (This is the computer equivalent of your mother calling your sister to see how she is doing, and then calling you with any bad news.)
SNMP provides a standard message format that the monitoring system, routers, switches, servers, storage arrays, UPS devices, etc., can all speak – even though they will be running different operating systems. Of course, there are different versions of SNMP, and different security issues, and different types of information that the different devices can report.
But if you are responsible for ensuring the performance, availability and capacity of your infrastructure, enabling and using SNMP and a monitoring system to collect and alert on data is the way to go. This system can scale from monitoring one device to tens of thousands, alerting you when something is wrong (and hopefully, letting you sleep when everything is OK.)
How SNMP Agents and Network Management Stations work
Discussions about SNMP often involve two concepts: SNMP agents, and Network Management Stations. To put it simply: a Network Management Station (NMS) asks questions; an SNMP agent answers them.
The SNMP agent is a software process that receives SNMP queries, retrieves the data being asked for, and replies back. Most routers, switches, firewalls, and other systems without a full operating system will have SNMP support built in to the software. General purpose servers (Linux, Solaris, AIX, Windows, FreeBSD, etc) may not have an SNMP agent installed by default, depending on the installation options chosen, but one can be added at any time. The most common SNMP agent for Linux and Unix based systems is the net-snmp agent, which runs as snmpd (the SNMP Daemon.) Installing, configuring and running this agent will add SNMP support to any system that supports it.
A Network Management Station is harder to pin down. It could be anything from a single linux machine with snmpwalk that is used to do ad hoc command line queries against devices, to a simple management system like What’s Up Gold, to a complete powerful system like LogicMonitor (where the collectors initiate the SNMP questions, but the storage, analysis, and alerting is centralized in a SaaS infrastructure.) But as noted above: if a system initiates SNMP questions, it can be thought of as an NMS. (Note that a system can have both the SNMP agent and an NMS installed.)
Both SNMP agents and NMS’s will talk SNMP to each other: i.e. a defined IP protocol – the standard message format mentioned earlier.
A Guide to SNMP’s Key Acronyms: SMI, MIBs, OIDs and other TLAs
Any discussion of SNMP will soon involve a selection of acronyms. We’ll explain the most common here.
SMI: Structure of Management Information.
SMI is a subset of ASN 1 (Abstract Syntax Notation One – which, in the context of SNMP, you do not need to know anything more about. You can read “SMI” wherever you see “ASN.1”.) SMI is basically the syntax that MIBs are written in, defining the data types available, and how to reference other MIB files. For example, SMI v2 defines a TIMETICK object as:
TIMETICKS
The TimeTicks type represents a non-negative integer which represents the time, modulo 2^32 (4294967296 decimal), in hundredths of a second between two epochs. When objects are defined which use this ASN.1 type, the description of the object identifies both of the reference epochs.
The TimeTick type can then be used to define other objects in the MIB.
MIB: Management Information Base.
A MIB is usually a plain-text file, that defines the database of entities, in a tree structure, that is the set of management information available on an SNMP agent. Each object in the MIB file has an Object Identifier.
OID: Object Identifier.
This is simply a way to uniquely identify an object in a tree. Each number in the OID identifies a node in the MIB tree. The important thing to remember is that each complete OID represents a single object in the MIB – usually this means one specific question that can be asked of the SNMP agent, and you arrive at that object by traversing down the tree, starting from the root node.
For example, you can see the OID .1.3.6.1.2 refers to the Management node in the diagram below.
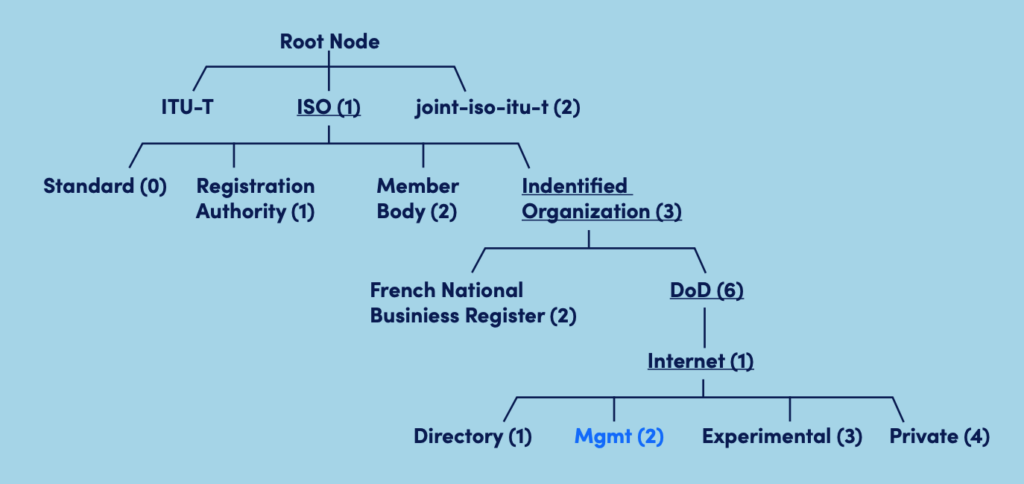
Each organization manages or delegates management for the numbers below it. Thus the ISO – the International Organization for Standardization – (.1) allocated .1.3 to mean Identified Organization, and .1.3.6 to mean the Department of Defense (reflecting the Internet’s origins as a U.S. Defense Research Project.)
In practice this means that every OID you will deal with will either begin with .1.3.6.1.2 (the standard Management OIDs, that are vendor neutral); or .1.3.6.1.4.1 (the private OIDs. Each vendor can be assigned their own private number below .4.1, and then manage their own OID objects below this. Cisco Systems was allocated .9 – thus all Cisco Systems OIDs, for information they want to return that is specific to Cisco equipment, is under .1.3.6.1.4.1.9.)
You can see a complete list of enterprises that have been assigned private OID numbers at: http://www.iana.org/assignments/ enterprise-numbers/enterprisenumbers.
An example of a MIB file is this extract from the RFC1213 MIB on the right:
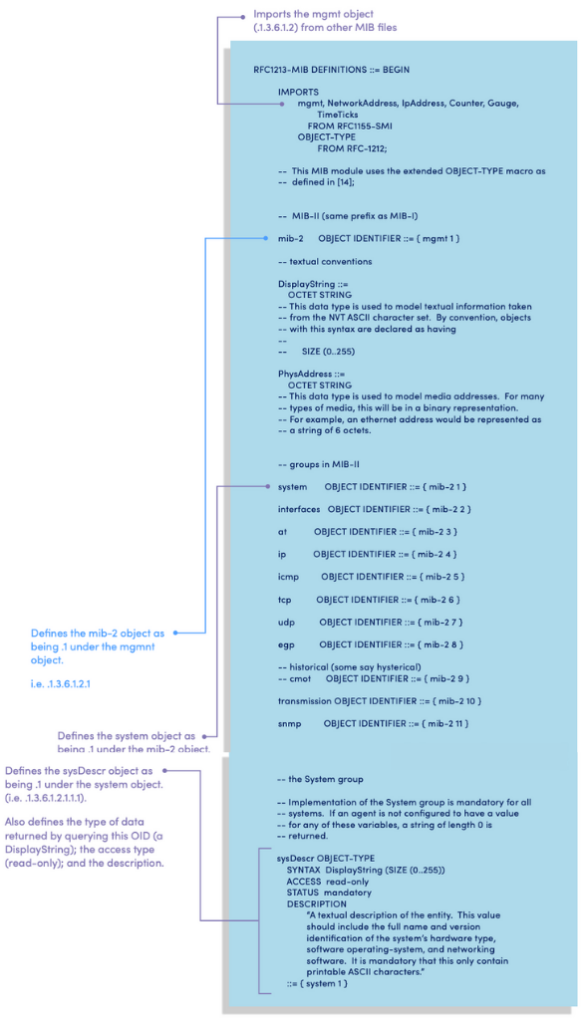
This long text file extract above defines the object .1.3.6.1.2.1.1.1.0 to be the sysDescr object, and specifies that when an SNMP agent is queried for this OID, it should return a textual description of the system.
To make this all a little less abstract, we can perform this query using a simple tool snmpwalk, that is included in most Linux packages:
Here, we query a Linux server for the OID .1.3.6.1.2.1.1.1.0:
[demo1.dc7:~]$ snmpwalk -v1 -cSecret 127.0.0.1 .1.3.6.1.2.1.1.1.0Its response tells us its system description:
SNMPv2=MIB::sysDescr.0 = STRING: Linux demo1.logicmonitor.net
2.6.32-358.6.2.el6.centos.plus.x86_64 #1 SMP Thu May 16 17:43:34 UTC
2013 x86_64
Here we query a Cisco switch:
[demo1.dc7:~]$ snmpwalk -v1 -cSecret sw-core2 .1.3.6.1.2.1.1.1.0Which returns a different description:
SNMPv2=MIB::sysDescr.0 = STRING: Cisco IOS Software, C3560 Software
(C3560-IPSERVICESK9-M), Version 12.2(58)SE1, RELEASE SOFTWARE (fc1)
Technical Support: http://www.cisco.com/techsupport
Copyright (c) 1986-2011 by Cisco Systems, Inc.
Compiled Thu 05 May 11 02:19 by prod_rel_team
One thing to note is that OID’s can represent objects in a table, if the SNMP agent may have multiple items with the object in question. In this case, each row in the table will be about one of the items. For example, interfaces – there is an OID for the Interface Description; and another for the number of Octets received on that interface. But a computer may have many interfaces
Versions of SNMP
There are three commonly used versions of SNMP.
SNMP version 1: the oldest flavor. Easy to set up – it only requires (and only supports) a plaintext community. The biggest downsides are that it does not support 64 bit counters, only 32 bit counters, and that it has little security.
SNMP version 2c: in practical terms, v2c is identical to version 1, except it adds support for 64 bit counters. This matters, especially for interfaces: even a 1Gbps interface can wrap a 32 bit counter in 34 seconds. This means that a 32 bit counter being polled at one minute intervals is useless, as it cannot tell whether successive samples of 30 and 40 are due to the fact that only 10 octets were sent in that minute, or due to the fact that 4294967306 (2^32 +10) octets were sent in that minute. Most devices support snmp V2c nowadays, and generally do so automatically. There are some devices that require you to explicitly enable v2c – in which case, you should always do so. There is no downside.
SNMP version 3: adds security to the 64 bit counters. SNMP version 3 adds both encryption and authentication, which can be used together or separately. Setup is more complex than just defining a community string – but then, what security is not? But if you require security, this is the way to do it.
So which should you use?
The only security measures for SNMP versions 1 and 2c are a community string sent in plaintext, and the ability to limit the IP addresses that can issue queries. This is effectively no security from someone with access to the network – such a person will be able to see the community string in plaintext, and spoofing a UDP packet’s source IP is trivial. However, if your device is set up to only allow SNMP read-only access, the risk is fairly small, and confined to
evil people with access to your network. If you have evil people with this access, people reading device statistics by SNMP is probably not what you need to be worrying about. So, if you can accept the weak security model of SNMP v2c, use that. If not, use V3 with encryption and authentication.
Questions, Answers and Traps
There are two methods of information transfer in SNMP. One is to query an OID, and receive an answer (given that this act of querying is usually done periodically, this is often called polling.) In order to check the temperature of a Cisco device, you can poll the rows of the OID table .1.3.6.1.4.1.9.9.13.1.3.1.3 to get the temperature, and .1.3.6.1.4.1.9.9.13.1.3.1.6 to see if the temperature is triggering any warning or error states.
The other method of information transfer is to use Traps. Traps are initiated by the SNMP agent. i.e. instead of the NMS polling an OID periodically to see if the temperature state is a cause for alarm, the device can just send the NMS a notification when the temperature exceeds a threshold. This sounds good, in that you will get immediate notification as soon as an alert condition occurs, instead of having to wait for a poll to detect the condition. Another possible advantage is that there is no load on the NMS, network or monitored device, to support the periodic polling. However, traps have some significant disadvantages.
Firstly, consider what a trap is – a single UDP datagram, sent from a device to notify you that something is going wrong with that device. Now, UDP (User Datagram Protocol) packets (unlike TCP) are not acknowledged, and not retransmitted if they get lost and don’t arrive, since the sender has no way of knowing if it arrived or not. So, a trap is a single, unreliable notification, sent from a device at the exact time that a UDP packet is least likely to make it to the management station – as, by definition, something is going wrong.
The thing going wrong may be causing spanning tree to re compute, or routing protocols to reconverge, or interface buffers to reset due to a switchover to redundant power supply – not the time to rely on a single packet to tell you about critical events. Traps are not a reliable means to tell you of things that can critically affect your infrastructure – this is the main reason to avoid them if possible.
Another reason traps can be problematic is, ironically, manageability. In order for a trap to be sent and arrive at the management station, you have to configure the trap destination – the NMS’s IP address – into every device.
On every switch, every router, every server…. But, you may ask, don’t you have to do this to set up the SNMP community on the devices anyway, to enable polling? Yes – but usually when SNMP communities are defined, polling is enabled for entire networks or subnets. You can move your monitoring system to another IP on the same subnet, and not have to change any configuration.
But if you rely on traps, you now have to touch every device and reconfigure it to send traps to the new destination. And more significantly, it’s very hard to test that traps will work. With polling, it’s easy to see (and be alerted on) data not returning due to a misconfigured community, firewall or access list. It is much harder to be confident that a system is set up to trap to the right place, and that access-lists are set correctly to allow the traps. (And of course, traps use a different port than regular SNMP queries, so the fact polling works tells you nothing about whether traps will work.)
By definition, polls are tested every minute or so. A trap is usually sent only when a critical event occurs, with no notification or feedback if it fails. Which would you rather depend on for the health of your infrastructure and applications?
The final advantage of polling is that it can provide trending, and context. Consider the following graph:
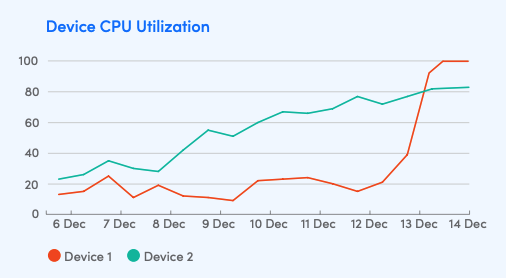
Using either traps or polling, you could receive an alert about the fact that CPU utilization has exceeded 80%. But if you are solely relying on traps for your data, you would not have any further information. One system seems to need immediate action – the CPU usage started growing rapidly. The other system has been growing its usage slowly and steadily for a week, so most likely has at least a few more days before calamity. Relying on traps, which would not provide this data, would not allow you to make an informed decision about how to react differently to these two systems.
What does “SNMP Support” in a device mean?
Pretty much any device you see being sold into the datacenter or IT space will claim “SNMP support”. This is kind of like saying that a two-year old toddler and Usain Bolt are both capable of running – there are wildly disparate differences in what “SNMP support” can mean. Some devices will support a very limited set of information that is available through SNMP; some will support all the standard mgmt objects; and some will support the standard objects, as well as thousands of OIDs they publish in their own MIBs.
The worst case is where a device will offer nothing useful via SNMP, except perhaps the version of software that it is running. This is SNMP support in name only.
The bare minimum that devices should support is basic management functionality, such as the data found in the mgmt subtree. (This will allow interface utilization, packets per second, CPU and memory usage, TCP statistics, etc, to be discoverable and reported.)
But the basic mgmt data will certainly not be sufficient in many cases. For example, knowing the interface data and TCP statistics is of little utility in monitoring a UPS (uninterruptible power supply), or a storage array (especially if the data is transferred over Fiber Channel, so that the interfaces do not show any indications of usage or traffic.) In these cases, you need the device to support a vendor supplied MIB, that provides a variety of OIDs that measure and report on data that is not standardized under the .1.3.6.1.2 tree.
For example, a UPS device should report on things like the time it has been running on battery; the reason for the switch to battery; the runtime remaining on battery before battery exhaustion; the state of the battery packs, etc. A storage array should report things like drive health; free/unprovisioned space; the latency of read/write requests by volume or LUN, etc.
The fact that a device vendor may provide a MIB that has lots of useful information in it does not necessarily solve your problems. For example, while APC does provide very powerful SNMP agents, and a detailed private MIB – their MIB has over 4500 objects in it – not all objects are supported by all APC devices; and most are not meaningful to ordinary use of the devices (e.g. 1. 3.6.1.4.1.318.1.1.9.4.2.2.1.4: “the rectifier physical address (the address on the bus).”).
What does “SNMP Support” in a Management System mean?
As noted above, an NMS can be as simple as a Linux workstation with SNMP utilities installed, so that you can perform SNMP gets. In theory, you could then wrap some scripts around snmpget and snmpwalk, to query the data you care about; compare it to some hardcoded thresholds; and run the script out of a cron job so that it repeats every 5 minutes.
This is probably not what you would consider a real NMS, however.
So while any system that can query and show the response to an SNMP query could be called an NMS, there are a few fundamental things that need to be there from a practical level:
Easily define what OIDs to query.
Ideally, this isn’t something you even need to think about. An NMS with true SNMP support will discover the kind of device; then have knowledge of which OIDs are appropriate to query for that device; and also periodically check to see if there are changes in the device’s configuration requiring new different OIDs to check. (For example, enabling Power-over Ethernet in a switch will turn on a whole new section of the MIB tree that should be queried.) The worst case is an NMS that requires you to manually define what OIDs to check. Yes, it’s technically supporting SNMP, but it’s not making your life any easier if you have to go through the 4500 objects in the APC MIB, just to ensure your UPS’s are correctly monitored.
Easily define how to interpret the data that is returned.
SNMP data can be returned as gauges (e.g. the current temperature in Celsius); counters (how many packets have passed through the interface since the system started); strings, bitmaps, etc. Counters need to be converted to a rate, in most cases, by subtracting the prior counter value from the current, and dividing by the time interval between samples. This should be automatically handled by the NMS.
Easily define the thresholds that should trigger alerts.
Again, ideally the NMS should take away a lot of the need for this, and have pre-defined alerts for everything that could impact production systems, but there will always be customization required – either for systems that are not mission-critical, and so have a greater tolerance for performance issues; or for custom metrics that are not pre-defined. This tuning should be an easy task.
You’ll notice that the items above all focus on ease of use – which should be the main goal of using an NMS – to make the job of ensuring the operational availability, capacity and performance of the systems easier. NMS systems that require you to modify text or XML files, or pore through thousands of MIB files and configure all the SNMP OIDs to query, may technically be NMS systems – but only in the loosest sense of the word.
There are many other things that an NMS may do in this regard, which will be of differing utility to different organizations:
• graph the variables being collected, so you can see the historical trend of the objects being collected.
• route and deliver the alerts via different mechanisms (chat, email, sms, voice calls) to different people, and escalate through different people and teams. This can alternatively be done by a separate tool.
• discover devices to be monitored via different mechanisms. • map devices logically at different OSI layers, or geographically.
• use different data collection mechanisms other than SNMP, to support devices that do not provide any, or limited, support of SNMP. An NMS that can also collect data via other protocols such as WMI, JMX, and various other APIs can be used to consolidate and replace multiple tools into one, and provide a more cohesive view of the whole environment.
and so on.
Installing SNMPd on Linux
Installing an snmp daemon on Linux is very easy. Simply use the package manager to install the netsnmp package, and the utilities. On Redhat or Centos, this looks like:
yum install net-snmp

yum install net-snmp-utilsThere are many options to configure snmpd – you can limit the hosts that can query it by IP address; you can enable encryption and authentication for use with SNMP v3; you can even limit which OIDs the agent will respond to, when queried by different IP addresses, communities, or users.
However, in most uses, a simple configuration is reasonable (assuming the host is behind a firewall, and not exposed to the Internet.). The simplest configuration is to simply set the contents of /etc/snmp/snmpd.conf to this:
rocommunity MyCommunityThis will allow any device to query this system by SNMP, if they know the community MyCommunity. SNMP will not be enabled for any write, or set, operations, however.
You should then ensure SNMP is set to start automatically on system boot, and start it now, with these commands:
chkconfig snmpd on

service snmpd restartIf you find that SNMP is not responding to your queries from other hosts, some troubleshooting steps to check are:
- If you are running a firewall, such as iptables, on the server, ensure it is set to allow SNMP queries (UDP port 161) through.
- Similarly, if there are any other firewalls between the NMS and the server, ensure they are configured to allow SNMP queries through. You can see if the requests are arriving at the server by running tcpdump port 161. (If you have multiple interfaces, you will need to specify the correct one via the -i flag.) Note that this will show if you if the SNMP queries are arriving at the system – it will not show you if the local system’s firewall is rejecting the packets.
- Some distributions will include a version of the snmp agent that uses hosts.allow and hosts.deny files in the /etc directory, in conjunction with tcpwrappers, to further limit access. You can test this by adding the line snmpd: ALL to /etc/hosts. allow, and retrying your test.
- Of course, ensure you are using the correct SNMP community string.
Working at Scale
If you have more than one server to manage, you will need to set up SNMP access on all your devices. This is easily done with any of the popular configuration management tools (Ansible, Chef, Puppet, CFEngine, etc).
This is not specific to SNMP – the same practices should be used for the management of any configuration across more than one server. But ensuring that your SNMP configuration files are managed by a configuration management tool makes it easy to ensure it is correctly deployed to all servers; and allows easy changing of SNMP communities; adoption of SNMP v3, etc.
Conclusion
Hopefully you’ve gained an understanding of what SNMP is: why it is used; how it is configured; the type of systems that use it; and some of the pitfalls in talking about SNMP support. SNMP is the most widely deployed management protocol; it is simple to understand (although not always to use), and enjoys ubiquitous support. While some systems have alternate management systems – most notably Windows, which uses WMI in preference – a good knowledge of SNMP will take you a long way in being equipped to monitor a variety of devices and servers.
LogicMonitor’s unified monitoring platform expands possibilities for businesses by advancing the technology behind them.