
Collector Network Communication
Last updated on 30 March, 2021LogicMonitor can be thought of as a system. In most cases, the components actively involved are the Collectors installed in your datacenters and the servers providing your LogicMonitor account.
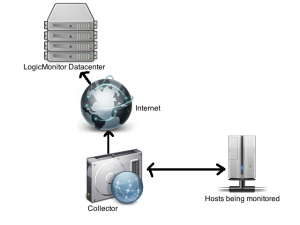
In the standard state, the Collectors use protocols such as SNMP and WMI from your systems to collect data from your monitored hosts, encrypt the data, and transmit it through an outgoing SSL connection to your LogicMonitor account:
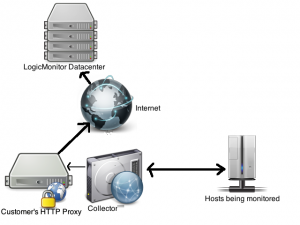
Where there are strict controls on outgoing HTTPS connections, you can configure Collectors to work through a proxy at your location to reach LogicMonitor.
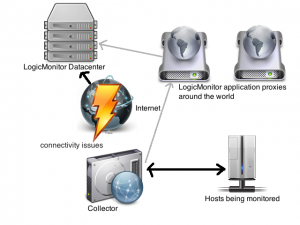
In the distributed Internet, there may be issues in the direct path between the Collector (or its proxy) and the LogicMonitor servers. In this situation, Collectors can lookup application proxies that LogicMonitor has operating in different zones around the Internet, and find one that is reachable and can also reach the responsible LogicMonitor servers.
The Collector then sends the encrypted traffic to these proxies, which will forward the traffic on to the primary LogicMonitor servers, thus avoiding most connectivity issues. When the Collector detects that direct reachability issues have been resolved, it will revert back to direct communication.
Collector Bandwidth Usage
LogicMonitor is designed to be efficient with your bandwidth. While the exact amount of bandwidth usage depends on the kinds of resources being monitored (a storage array with thousands of volumes has more data to report than a temperature probe, for example), the following are data from our active customer base:
- The average bandwidth usage of a Collector reporting back to LogicMonitor is 3.2Kbps per resource monitored.
- The median bandwidth usage of a Collector reporting back to LogicMonitor is 2.3Kbps per resource monitored.
This means that you could have about 300 resources monitored by a Collector before it will use 1Mbps (or 420 resources if you use the median bandwidth).