Cluster Alert Tuning Tab (New UI)
Last updated on 27 March, 2023The Cluster Alert Tuning tab is available when you select a Resources group.
Cluster alerts monitor and alert on datapoints across multiple resources in a resource group. They are designed to provide quick insight into the overall state of a collection of devices or cloud resources. For example, this can be useful when you have a pool of resources that are serving an application or performing a task; while you may not be too concerned with an issue that affects a single resource in the pool, you’ll likely want to know immediately if the pool of resources as a whole is at risk of not being able to serve its purpose. In a case like this, you could configure a cluster alert to trigger when five batch servers have CPU usage rates higher than 80%.
Cluster alerts trigger based on the presence of individual alerts for devices or instances belonging to the same group of resources. For example, using the scenario provided in the previous paragraph, five batch servers in the group would need to have 80% set as an alert threshold for CPU usage and would need to have exceeded that threshold in order for the cluster alert to trigger. Because cluster alerts rely on individual datapoint alerts, it’s important that you keep datapoint thresholds tuned, as discussed in Tuning Static Thresholds for Datapoints.
Note: Cluster alerts are a simple way to measure the overall health of a group of resources. For more sophisticated monitoring and alerting capabilities across groups of resources, consider LM Service Insight, a feature that groups instances across one or more monitored resources (e.g. devices) into logical “Services”. For more information, see About LM Service Insight.
Configuring Cluster Alerts
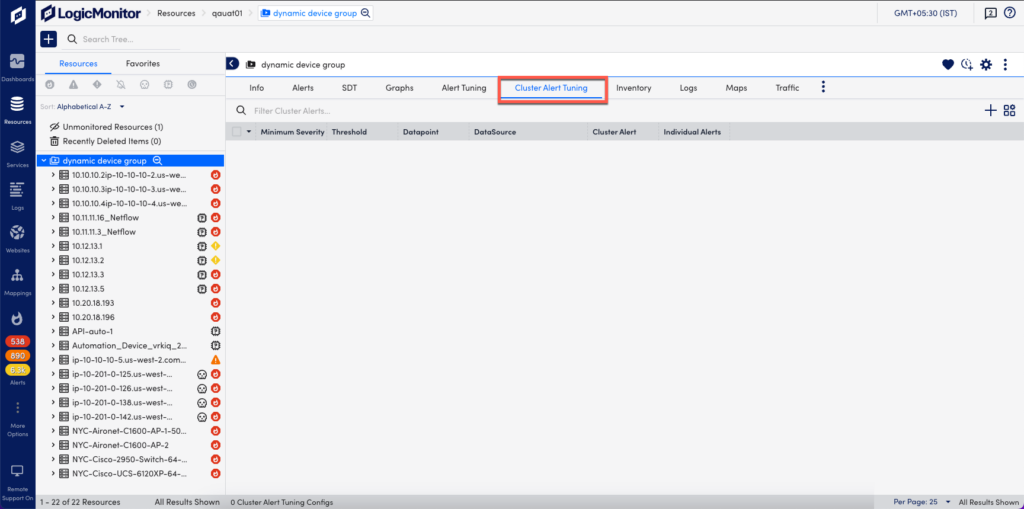
Cluster alerts are configured from the Resources page. From the Resources tree, select the resource group for which you are configuring the cluster alert and, from the group’s detail view, open the Cluster Alert Tuning tab.
Adding a New Cluster Alert
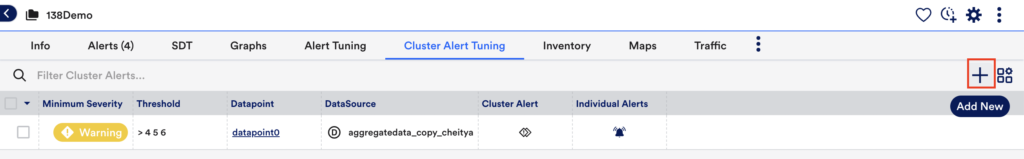
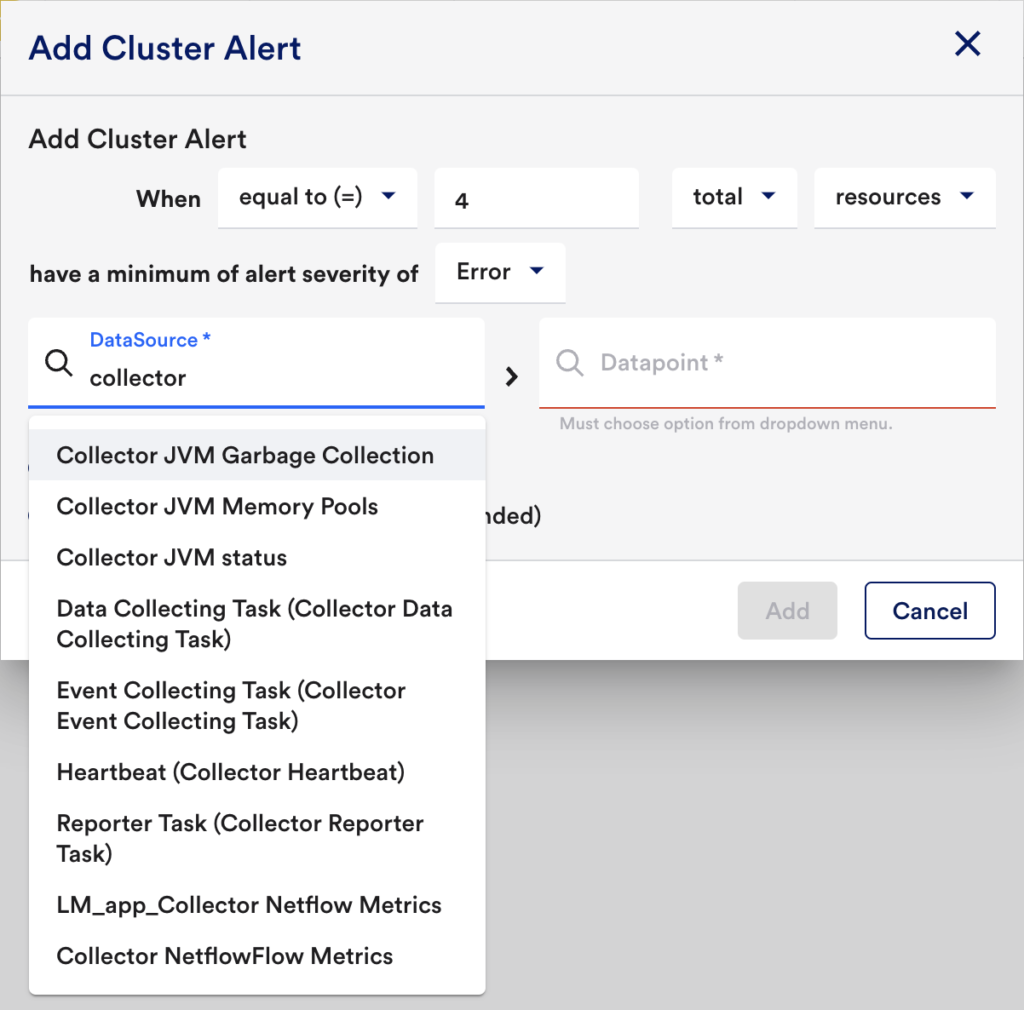
Click Add New (plus sign +) to open the Add Cluster Alert dialog.
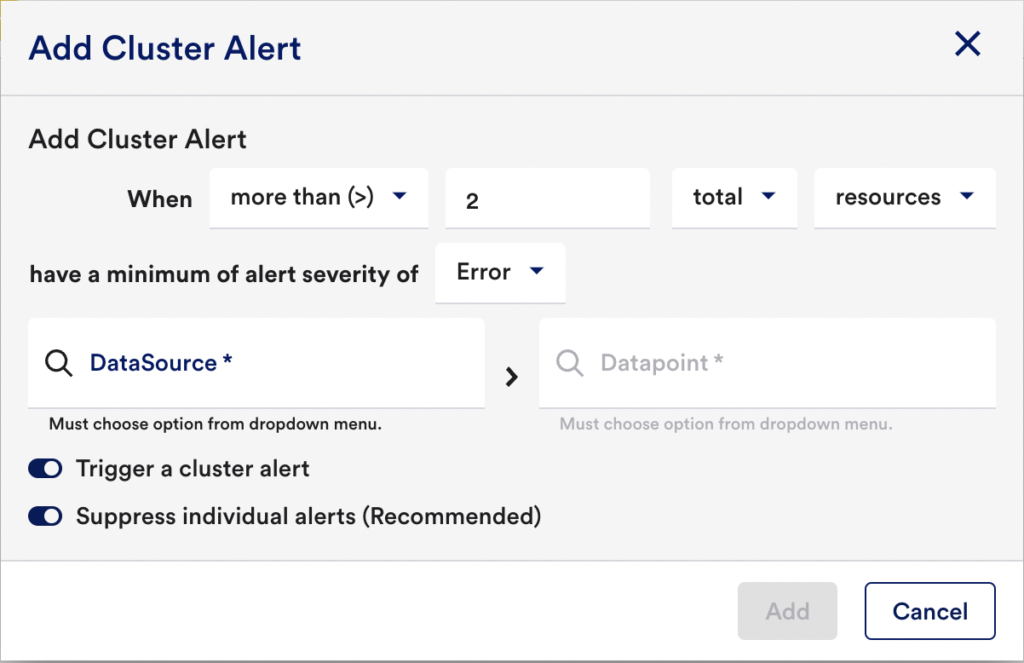
Number of Devices/Instances that Must Meet Alert Level Required to Trigger Cluster Alert
In order to specify the number or percentage of devices or instances that must meet the alert severity level specified in the previous field, a total of four fields must be configured:
| Field | Description |
| Comparison Operator | Select the comparison operator that will be applied to the total number or percentage (e.g. greater than the total provided).Equal ToMore ThanLess ThanMore Than or Equal ToLess Than or Equal To |
| Threshold Value | Enter the Total or Percentage Of devices in the device group that must meet the alert severity level specified by the Add Cluster Alert When field. Similar to datapoint thresholds, you can enter a number for each alert level. |
| Total or Percentage Of | Select Total to indicate that the threshold is a static device or instance count. Select Percentage Of to indicate that the threshold is a percentage of the total number of devices or instances in the group. |
| Resources or Instances | From the dropdown, indicate whether the threshold count or percentage is calculated using the number of Resources in alert or the number of Instances. |
Individual Device/Instance Alert Level Required to Trigger Cluster Alert
From the Have a minimum alert severity of field, select the minimum alert severity level that individual devices/instances must be in in order for them to contribute toward the overall number of devices/instances required to trigger the cluster alert.
DataSource and Datapoint
From the fields provided, choose the DataSource and Datapoint datapoint to be evaluated. You can scroll through the list or begin typing to sort.
Managing Cluster Alerts
Once a cluster alert is configured and saved, it is displayed on the Cluster Alert Tuning tab. Click anywhere in the row to view, edit, or delete an existing cluster alert.
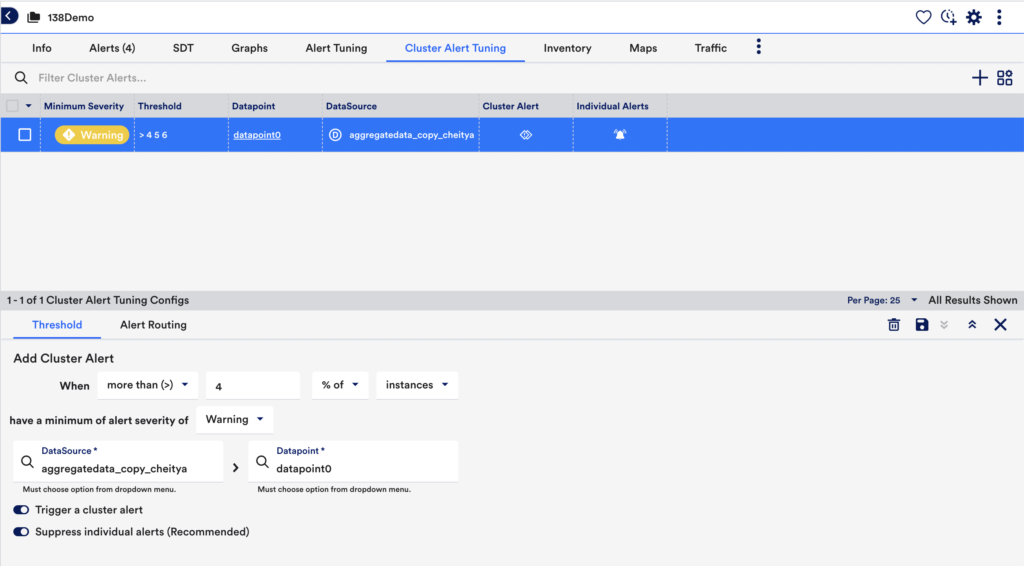
Enabling Individual Alerts
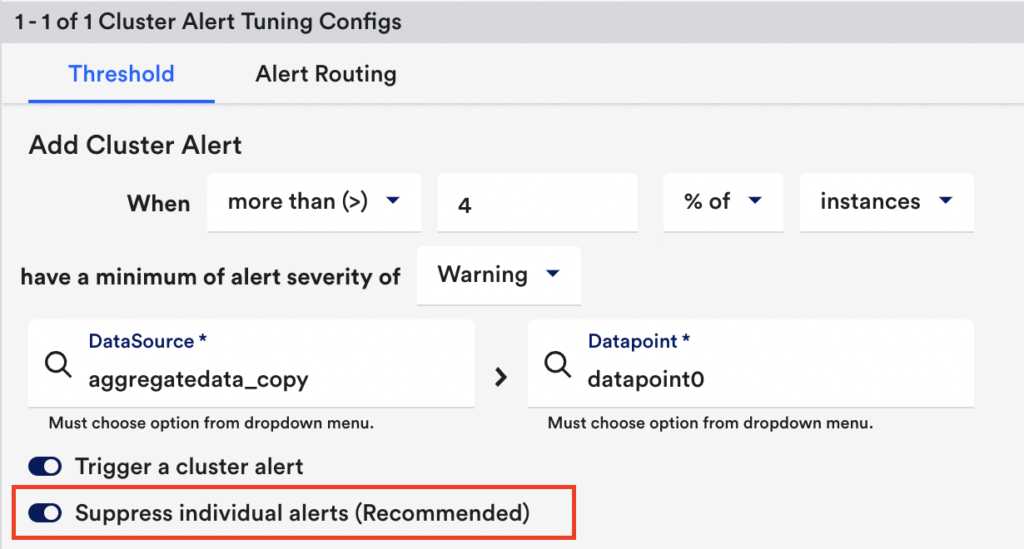
LogicMonitor assumes that cluster alerts supersede individual datapoint alerts for the resources in the group. For this reason, individual datapoint alert notifications are suppressed by default when you configure and save a cluster alert. The alerts are displayed, but alert notifications will not be routed. To change this setting, use the Suppress individual alerts toggle.
Disabling Cluster Alerts
Use the Trigger a cluster alert toggle to disable a cluster alert. When disabled, the cluster alert will no longer generate alerts.
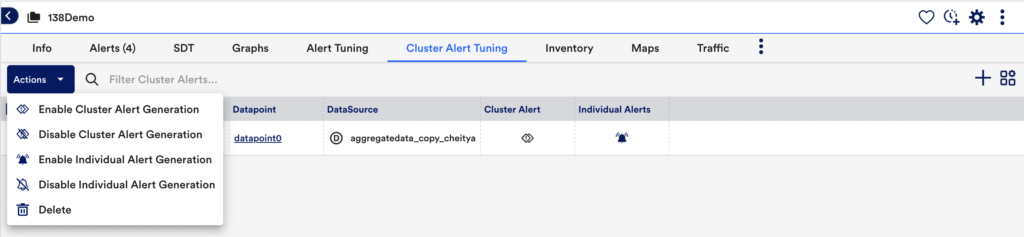
Cluster Alert Tuning Actions
As a shortcut, select the alert’s checkbox and then click Actions. This gives you options to enable, disable, or to delete the alert.
Routing Cluster Alert Notifications
As with all alerts, cluster alerts will appear on the Alerts page, as well as on the Alerts tab (available from the Resources page). A device name of “cluster” will always be assigned to a cluster alert. This generic device name can be used when specifying alert routing, filter, or reporting criteria.
If you’d additionally like notifications to be generated and routed for cluster alerts, you’ll need to configure an alert rule. At a minimum, this alert rule’s criteria must match the group for which the cluster alert is configured. If you’d like the cluster alerts to be routed differently than other alerts for the group, deeper-level matching can be accomplished by setting the alert rule to match the “cluster” device. For more information on alert rules, see Alert Rules.
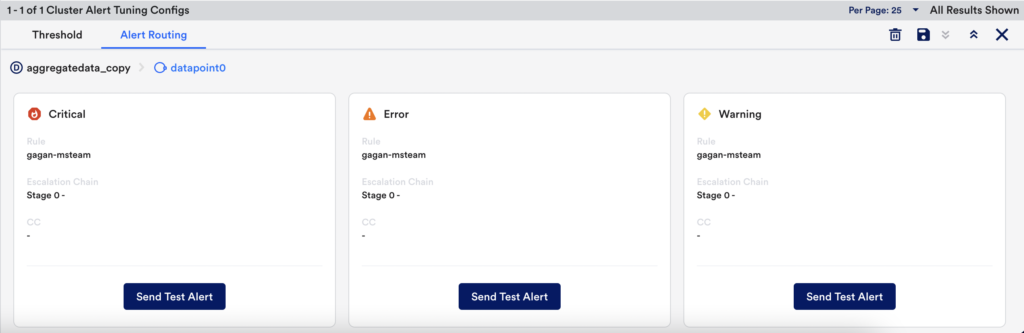
Send Test Alert
To test alert notifications, select the alert from the Cluster Alert Tuning tab and then click Alert Routing. Click Send Test Alert for the alert that you want to test. The process for testing alert notification routing for a cluster alert is identical to testing alert notification routing for a particular datapoint/instance pair. See Testing Alert Delivery for more details.