
Monitoring Your Collectors
Last updated on 07 December, 2022Overview
The LogicMonitor Collector is the heart of your monitoring system. As such, it’s important that you monitor your Collectors to ensure that performance is keeping up with data collection load. Equally important is ensuring the least disruption possible when a Collector does go down. This includes making sure timely notifications are delivered to the appropriate recipient(s).
As best practice, LogicMonitor recommends that you (1) set up monitoring for your Collectors and (2) configure notification routing for Collector down alerts.
Adding the Collector Host into Monitoring
If it isn’t already part of your monitoring operations, add the device on which the Collector is installed into monitoring. This will allow you to keep tabs on CPU utilization, disk space and other metrics important to smooth Collector operation. For more information on adding devices into monitoring, see Adding Devices.
Enabling Collector DataSources on the Host
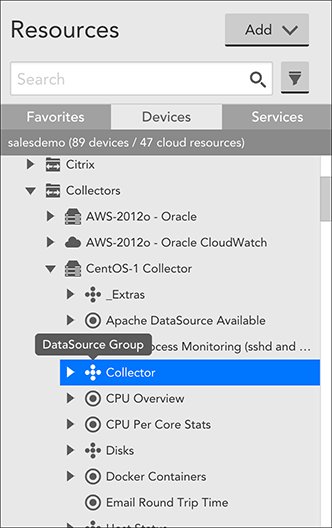
LogicMonitor provides a series of built-in Collector DataSources that provide insight into a Collector’s operations, performance, and workload. In most cases, these Collector DataSources will be automatically applied to the Collector device when you add it into monitoring. You can verify this is the case by expanding the device in the Resources tree and looking for the “Collector” DataSource group.
If the Collector DataSources were not automatically applied to the device, you can do so manually by adding the value of “collector” to the device’s system.categories property. For more information on setting properties, see Resource and Instance Properties.
LogicMonitor will now index this device as the host of a Collector, and automatically apply the Collector DataSources to it. Once Collector DataSources are in place, you can configure alerts to warn you when Collector performance is deficient.
Note: Collector DataSources only monitor the device’s preferred Collector (as established in the device’s configurations). The preferred Collector should be the Collector that is installed on that device. Otherwise, the Collector’s metrics will display on the wrong host. For example, if you attempt to monitor Collector A using Collector B (installed on a separate host), then Collector B’s metrics will display in lieu of Collector A’s on Collector A’s host.
Collector DataSources
Migration from Legacy DataSources
In March of 2019, LogicMonitor released a new set of Collector DataSources. If you are currently monitoring Collector hosts using the legacy DataSources, you will not experience any data loss upon importing the newer DataSources in this package. This is because DataSource names have been changed to eliminate module overwriting.
However, you will collect duplicate data and receive duplicate alerts for as long as both sets of DataSources are active. For this reason, we recommend that you disable the legacy Collector DataSources. The legacy DataSources are any Collector DataSources whose names are NOT prefixed with “LogicMonitor_Collector”. If prefixed with “LogicMonitor_Collector”, it is a current Collector DataSource.
When a DataSource is disabled, it stops querying the host and generating alerts, but maintains all historical data. At some point in time, you may want to delete the legacy DataSources altogether, but consider this move carefully as all historical data will be lost upon deletion. For more information on disabling DataSources, see Disabling Monitoring for a DataSource or Instance.
DataSource Example Highlight: Collector Data Collecting Tasks
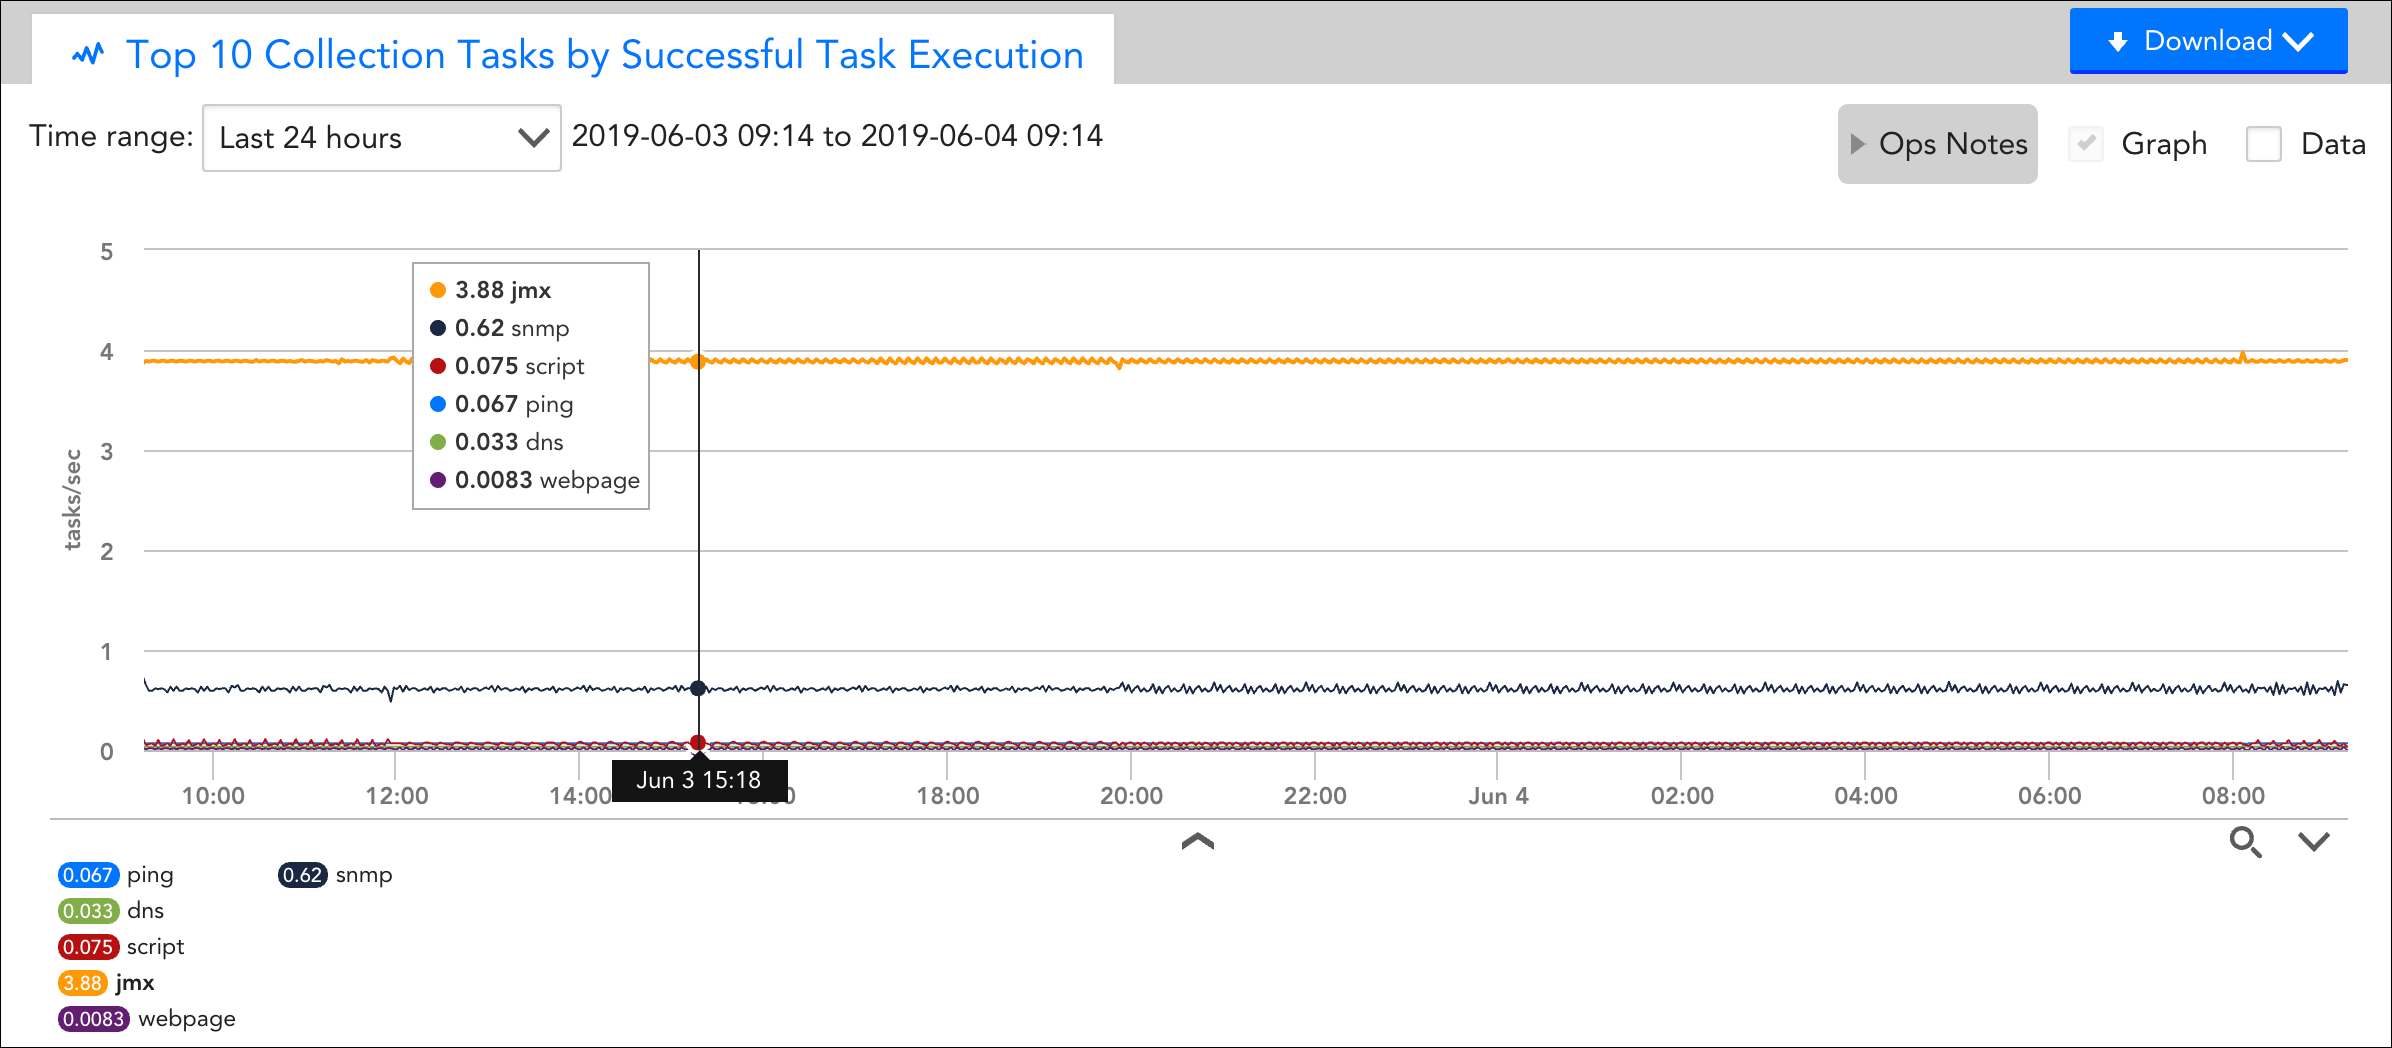
One of the Collector DataSources applied is the “Collector Data Collecting Tasks” DataSource. It monitors statistics for collection times, execution time, success/fail rates, and number of active collection tasks. One of the overview graphs available for this DataSource features the top 10 tasks contributing to your Collector’s load, which is extremely useful for identifying the source of CPU or memory usage.
Routing Collector Down Alerts
A Collector is declared down when LogicMonitor’s servers have not heard from it for three minutes. Even though you will likely have a backup Collector in place for when a Collector goes down, it’s never an ideal situation for a Collector to be unexpectedly offline. To minimize downtime and mitigate the risk of interrupted monitoring, ensure that “Collector down” alerts will actively be delivered (as email, text, and so on) to the appropriate individuals in your organization. (These alerts will also be displayed in the LogicMonitor interface. )
Important: When a Collector is declared down, alerts that were triggered by the devices monitored by that Collector before the Collector went down will remain active but new alerts will not be generated while the Collector is down. However, devices that do not fail over to another Collector will ignore the alert generation suppression and may generate Host Status alerts while the Collector status is down.
To route Collector down alerts, open the Collector’s configurations (Settings | Collector | Manage) and specify the following:
- Collector Down Escalation Chain. As discussed in Escalation Chains, an escalation chain specifies what people, or groups of people, should be notified of the alert, how they should be notified, and in what order.
- Resend interval. From the Send Collector Down Notifications field, set the resend interval for Collector down notifications. You can indicate no resend (i.e. notification is only sent once) or you can indicate the amount of time that should pass before the Collector down alert notifications are escalated to the next stage in the escalation chain. If the alert has reached the final stage or there is only one stage specified in the escalation chain, then this interval, when set, determines how often the alert notification will be resent until it is acknowledged or cleared.
Note: By default, an “Alert clear” notification is automatically delivered to all escalation chain recipients when a downed Collector comes back online. You can override this default by expanding the Collector details and unchecking the Alert on Clear option, shown next. However, if the Collector’s designated escalation chain routes alert notifications to an LM Integration, we recommend that you do not disable this option. For more information, see Alert Rules and Escalation Chains.