Using the Collector Debug Facility
Last updated on 08 July, 2022Overview
You can use the Collector Debug Facility to remotely run debug commands on your Collector. This is helpful for troubleshooting issues with data collection and is typically used on the advice of LogicMonitor support.
Note: The history of Collector debug commands is preserved in the Audit Log.
Accessing the Collector Debug Facility
There are two places from which you can launch the Collector Debug Facility:
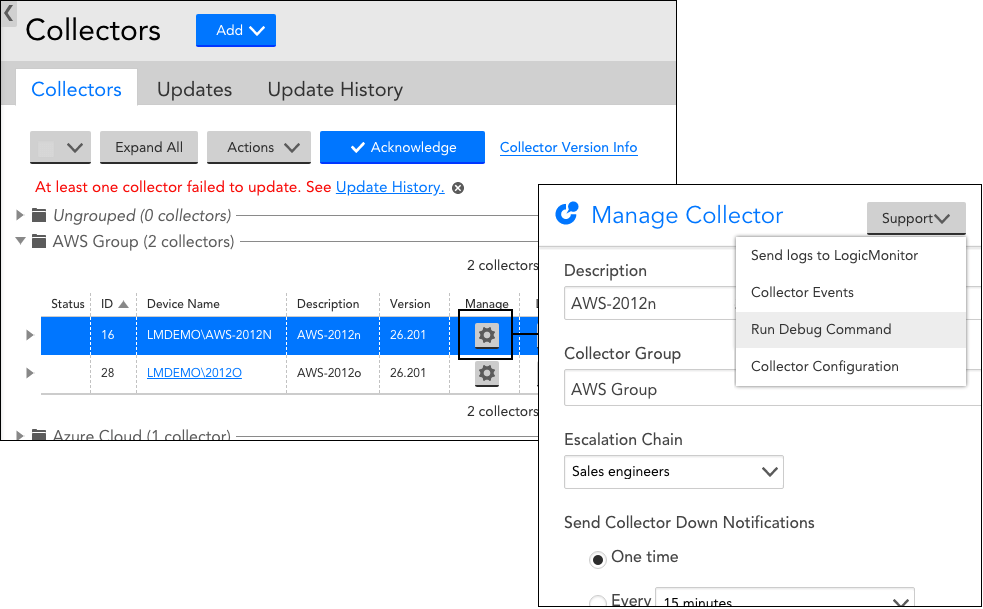
- From a Collector’s settings. As shown next, select Settings | Collectors, click the Settings icon for the Collector you would like to debug and, from the Support button’s dropdown, select “Run Debug” command.
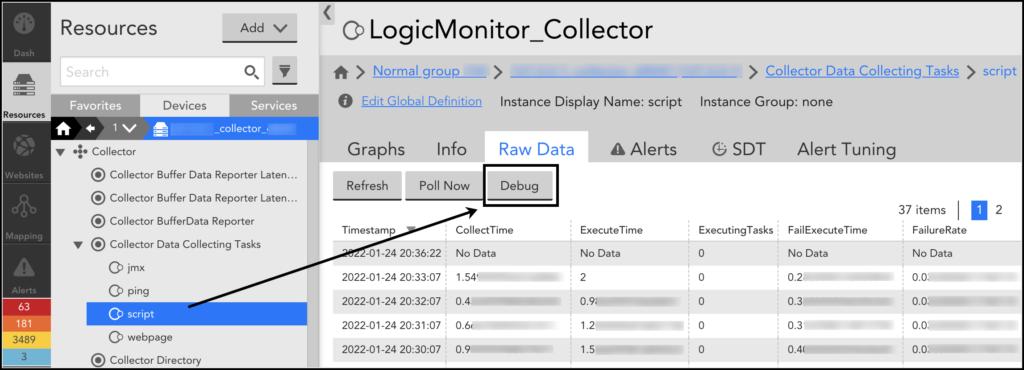
- From the Device Tree. Open the DataSource or DataSource instance that you would like to debug and from the Raw Data tab, click the Debug button.
Debug Command Syntax
The Collector Debug Facility launches in a new browser tab. A list of built-in debug commands and their descriptions display to assist with troubleshooting.
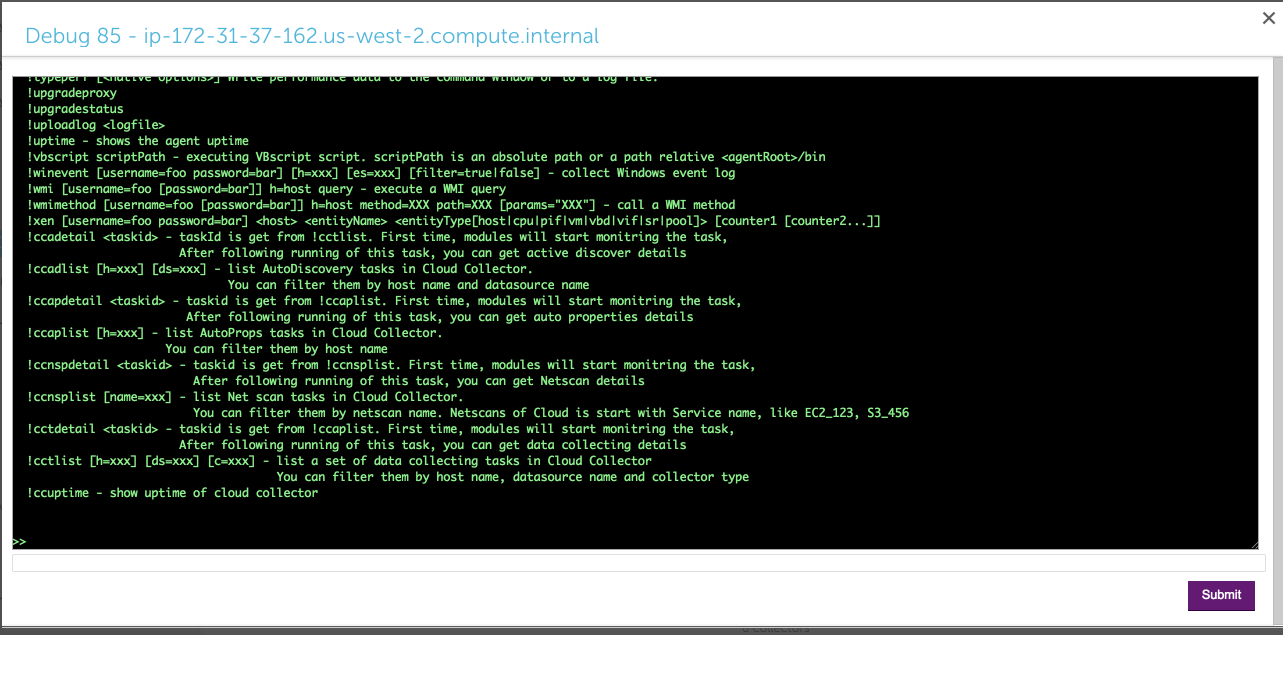
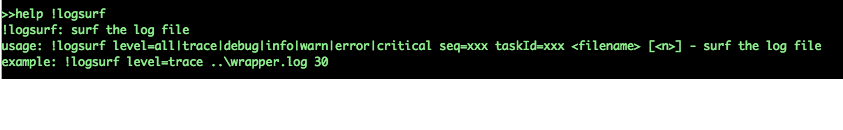
All debug commands should be preceded with a ‘!’. If you need syntax for a particular command, enter help !<commandname>, as shown next.
The following table highlights some of the most frequently used debug commands. For usage details (e.g. optional and mandatory arguments, parameters, etc.) and examples, enter the help !<commandname> from the Collector Debug Facility.
| Command | Description | Example |
| !account | Displays the account information used by sbwinproxy. | !account |
| !adlist | Displays a list of the Collector’s Active Discovery tasks. A taskID is returned for each task. | !adlist type=get !adlist method=ad_snmp |
| !adetail <taskId> | Displays detailed information about a specific Active Discovery task, where taskId can be found with !adlist. Note that the “taskId” reference in the command specification will be labeled as “id” in the output of the !adlist command. | !adetail 142 |
| !checkcredential | Enables, disables, and checks credential usage on the specified host to determine source of unexpected login action. | !checkcrendential proto=snmp user=public !checkcrendential proto=snmp user=public usage=AP |
| !hostproperty | Adds, updates, or deletes system properties for a host. | !hostproperty action=del host=localhost property=virtualization
!hostproperty action=add host=localhost property=ips value=127.0.0.1,192.168.1.1 |
| !http | Sends an HTTP request (with optional username and password) and displays the response. | !http http://www.google.com/index.html |
| !jdbc | Executes a SQL query against the specified host. | !jdbc ‘url=jdbc:mysql://productrds.chqwqvn285rf.us-west-2.rds.amazonaws.com:3306 username=LogicMonitor password=MyPassword’ select Name, ID from productDB.Employees |
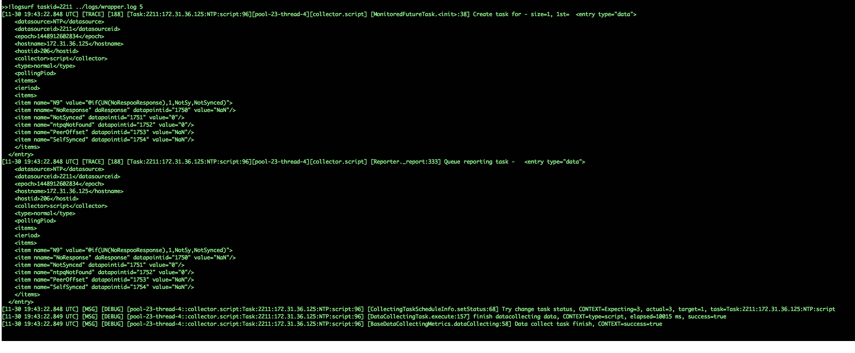
| !logsurf | Displays log file entries that are of the specified debug level. If included, logs will only be displayed for the specified seq and taskId if they are in the specified file, and only n number of logs will be displayed. taskId and seq can be found using !tlist, where taskId is the id of a data collection task and seq is the number of times the collector remembers having done the task. | !logsurf level=trace ../logs/wrapper.log taskid=833 seq=75 |
| !opssl | Lists ciphers and executes s_client using the locally installed OpenSSL binary. | |
| !ping | Pings the specified host. | !ping 10.36.11.240 !ping type=proxy 10.36.11.240 |
| !restart | Restarts the specified Collector service | !restart watchdog !restart collector |
| !shealthcheck func=<function> collector=<collector_id> | !shealthcheck commands help you determine the health of Collector, memory consumed, number of scheduled tasks, and more. Based on the result, you can debug the issues and resolve them. func=trigger This debug command triggers a healthcheck task for a specific Collector. Once you run this command, Santaba will schedule a healthcheck task for the specified Collector. To view the result, you must run !shealthcheck command with function func=detail or func=show. func=show Typically, you will find a summary of the scheduled task in the result. It also indicates the number of total, finished, and skipped healthcheck tasks. For example, “Latest run has finished. Scheduled checks (total=34, finished=27, skipped=7)” In case an issue is detected, the issue is summarised in the result. For example, “The disk has a low free space 728.57 MBytes.” You can run !shealthcheck func=detail collector=<collector_id> debug command to know the details of the issue or get details of the health status of a Collector. func=detail This debug command provides status of all the scripts in detail. For example, “Collector exported jars and executables are not modified.” “The Collector has 177 instances.” Once you run this command, Collector will display the result fetched by the func=trigger command. For example, for a specific Collector if you run the func=trigger command at 9.00 AM and then run func=detail at 11.00 AM, the Collector health status fetched at 9.00 AM will be displayed. | !shealthcheck func=show collector=123 !shealthcheck func=trigger collector=123 !shealthcheck func=detail collector=123 |
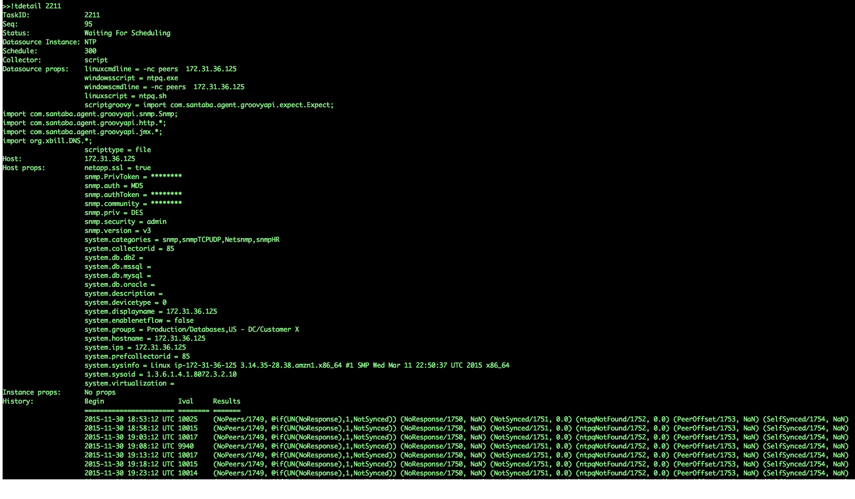
| !tdetail <taskId> | Displays detailed information about a specific data collection task, where taskId can be found with !tlist. | !tdetail 12323209239991 |
| !tlist | Lists the Collector’s data collection tasks, including DataSources, ConfigSources, and EventSources. A taskID is returned for each task. | !tlist c=wmi !tlist summary=collector !tlist summary=true lasttime=10 columns=5 |
| !uptime | Displays the uptime of the Collector. | !uptime |
Debug Example: Troubleshooting Data Collection
One of the most common uses of the Collector Debug Facility is troubleshooting data collection for a particular DataSource or DataSource instance. Maybe you just wrote a script DataSource and are getting NaN values, or perhaps one instance out of ten is not reporting data. You can typically use the following steps to identify the issue:
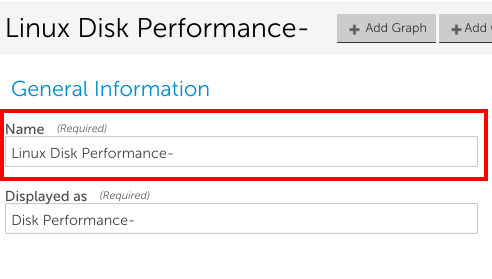
- Identify the DataSource or DataSource instance. Find the name of the DataSource in the DataSource definition (this is NOT the same as the display name).
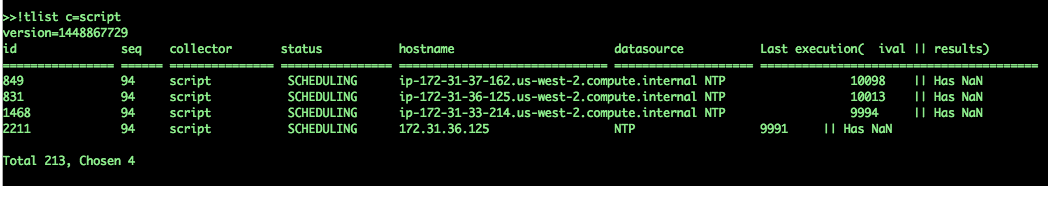
- Use the !tlist command in the Collector Debug Facility of the collector associated with the device the DataSource applies to. You can narrow down the results by using the h=<hostname> and c=<collection type> options.
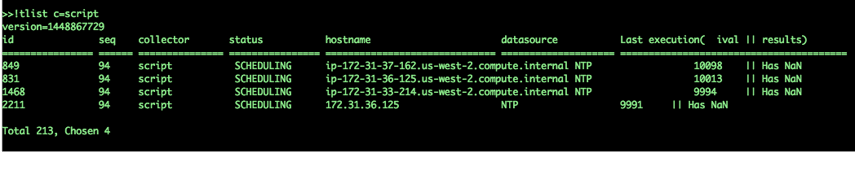
- Identify the task for the desired DataSource. You’ll see the taskid, followed by an execution count, followed by the collector type, a status, the device name, then the DataSource name, an ival (which is the amount of time it took to execute the task the last time), and finally, a note about the execution.
- Use the !tdetail command with the taskid as the argument.
- If you need more information to diagnose the problem, increase the log level for the appropriate collection method of the Collector, as discussed in Collector Logging.
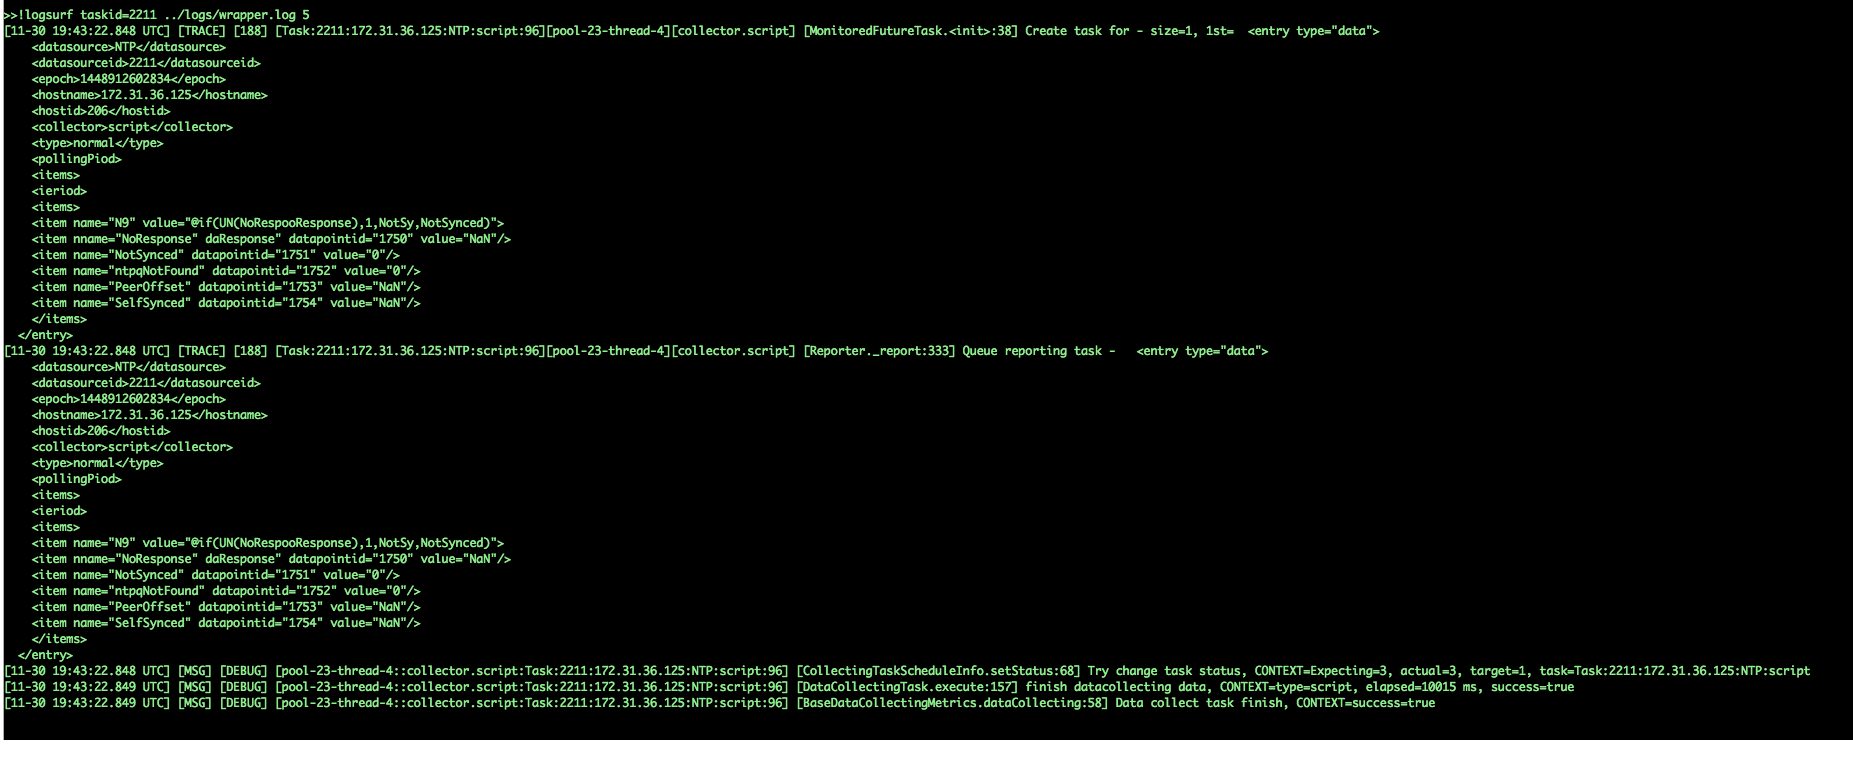
- Wait a polling cycle (or more) and then use the !logsurf command with taskid as an argument and ../logs/wrapper.log as the filename (if you know the latest execution count, you can also limit the results to one operation by including seq=n). You can also include a number argument to limit the results to a certain number of logs. You should see the log entries only for the task whose id is included in the command.
- If you still haven’t identified the issue, contact support.