Custom Graph Widget Overview
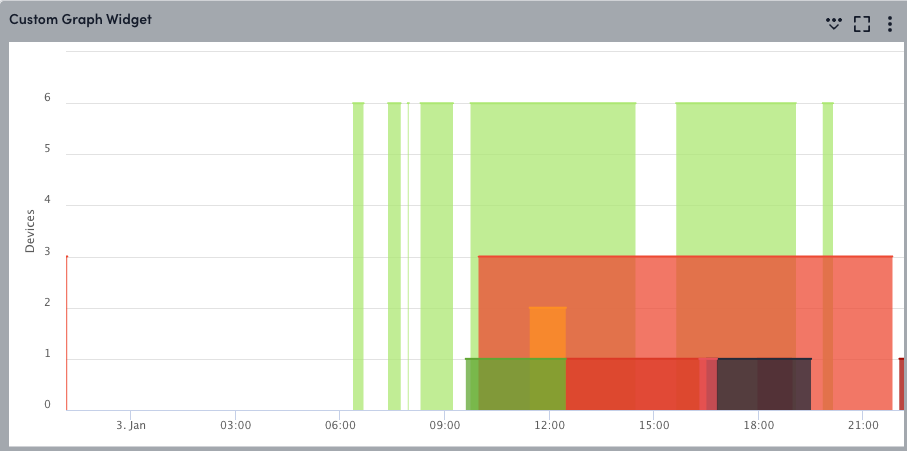
Last updated on 27 March, 2023The Custom Graph widget is one of the most powerful dashboard widgets in that it permits glob expressions in its configuration, enabling aggregate and top ten data to be displayed. For more information, see glob expressions.
You can use the Custom Graph widget to see the ten most important DataSource Instances from a single datapoint. For example, MemoryUtilizationPercent, CPUBusyPercent, or any other metric across your infrastructure. If the composition of the data changes during monitoring, the graph automatically updates based on the refresh frequency you delivered. This allows you to compare performance of any metric across resources.

After you’ve configured the Custom Graph widget, there are several ways you can manipulate the output and display of the widget from your dashboard. For example, you can include Ops Notes, expanding legends, viewing forecast conditions, or visualizing anomalies. These options are standard across most areas of the interface where graphs display. For more information, see Graphs Tab.
