
Dashboard Overview
Last updated on 09 January, 2021Introduction to Dashboards
Dashboards allow you to build a customized, strategic view of your systems, presented in the way that is most relevant to you and your business.
Dashboards can serve a variety of functions. They are commonly used to provide:
- An at-a-glance view of infrastructure performance
- A comprehensive view of application status
- Centralized metrics for cloud, hybrid, and virtualized infrastructures
- Executives with an overview of high level business metrics and performance
- Internal and external customers targeted insights into their infrastructure
- A scratchpad of pinned instance widgets for root cause analysis
Building Dashboards
Once you have created a dashboard, as discussed in Creating Dashboards, you will select from a variety of widgets to build out its display. See Widget Overview for more information on widgets.
Overview and instance graphs can also be added to a dashboard directly from the Resources page, as discussed in Graphs Tab.
Dashboard Groups
Dashboard groups allow you to organize your dashboards based on shared characteristics, such as by application, office/datacenter location, or customer (if you are a managed service provider). You can restrict viewership of dashboard groups with the User permissions dialog.
Dashboard groups can be further divided into subgroups. Two common use cases for subgroups are:
- To give individual departments access to a general dashboard group which contains further subgroups, each dedicated to an application.
- You’re a managed service provider and you want to grant each customer access to their own general dashboard group while retaining the ability to restrict viewing rights for different teams via subgroups.
You can create a subgroup containing new or existing dashboards by designating a “Parent Group” in the “Add Dashboard Group” configuration dialog.
What are common types of dashboards?
The uses for dashboards can be as varied as the types of devices monitored in LogicMonitor, but there are some common types across accounts. These include:
- Business / executive metrics – Overview of metrics related to business success
- Device dashboard – Widgets and Graphs related to a specific device type
- Network dashboard – Collection of top 10 graphs, performance overview, and status of network devices
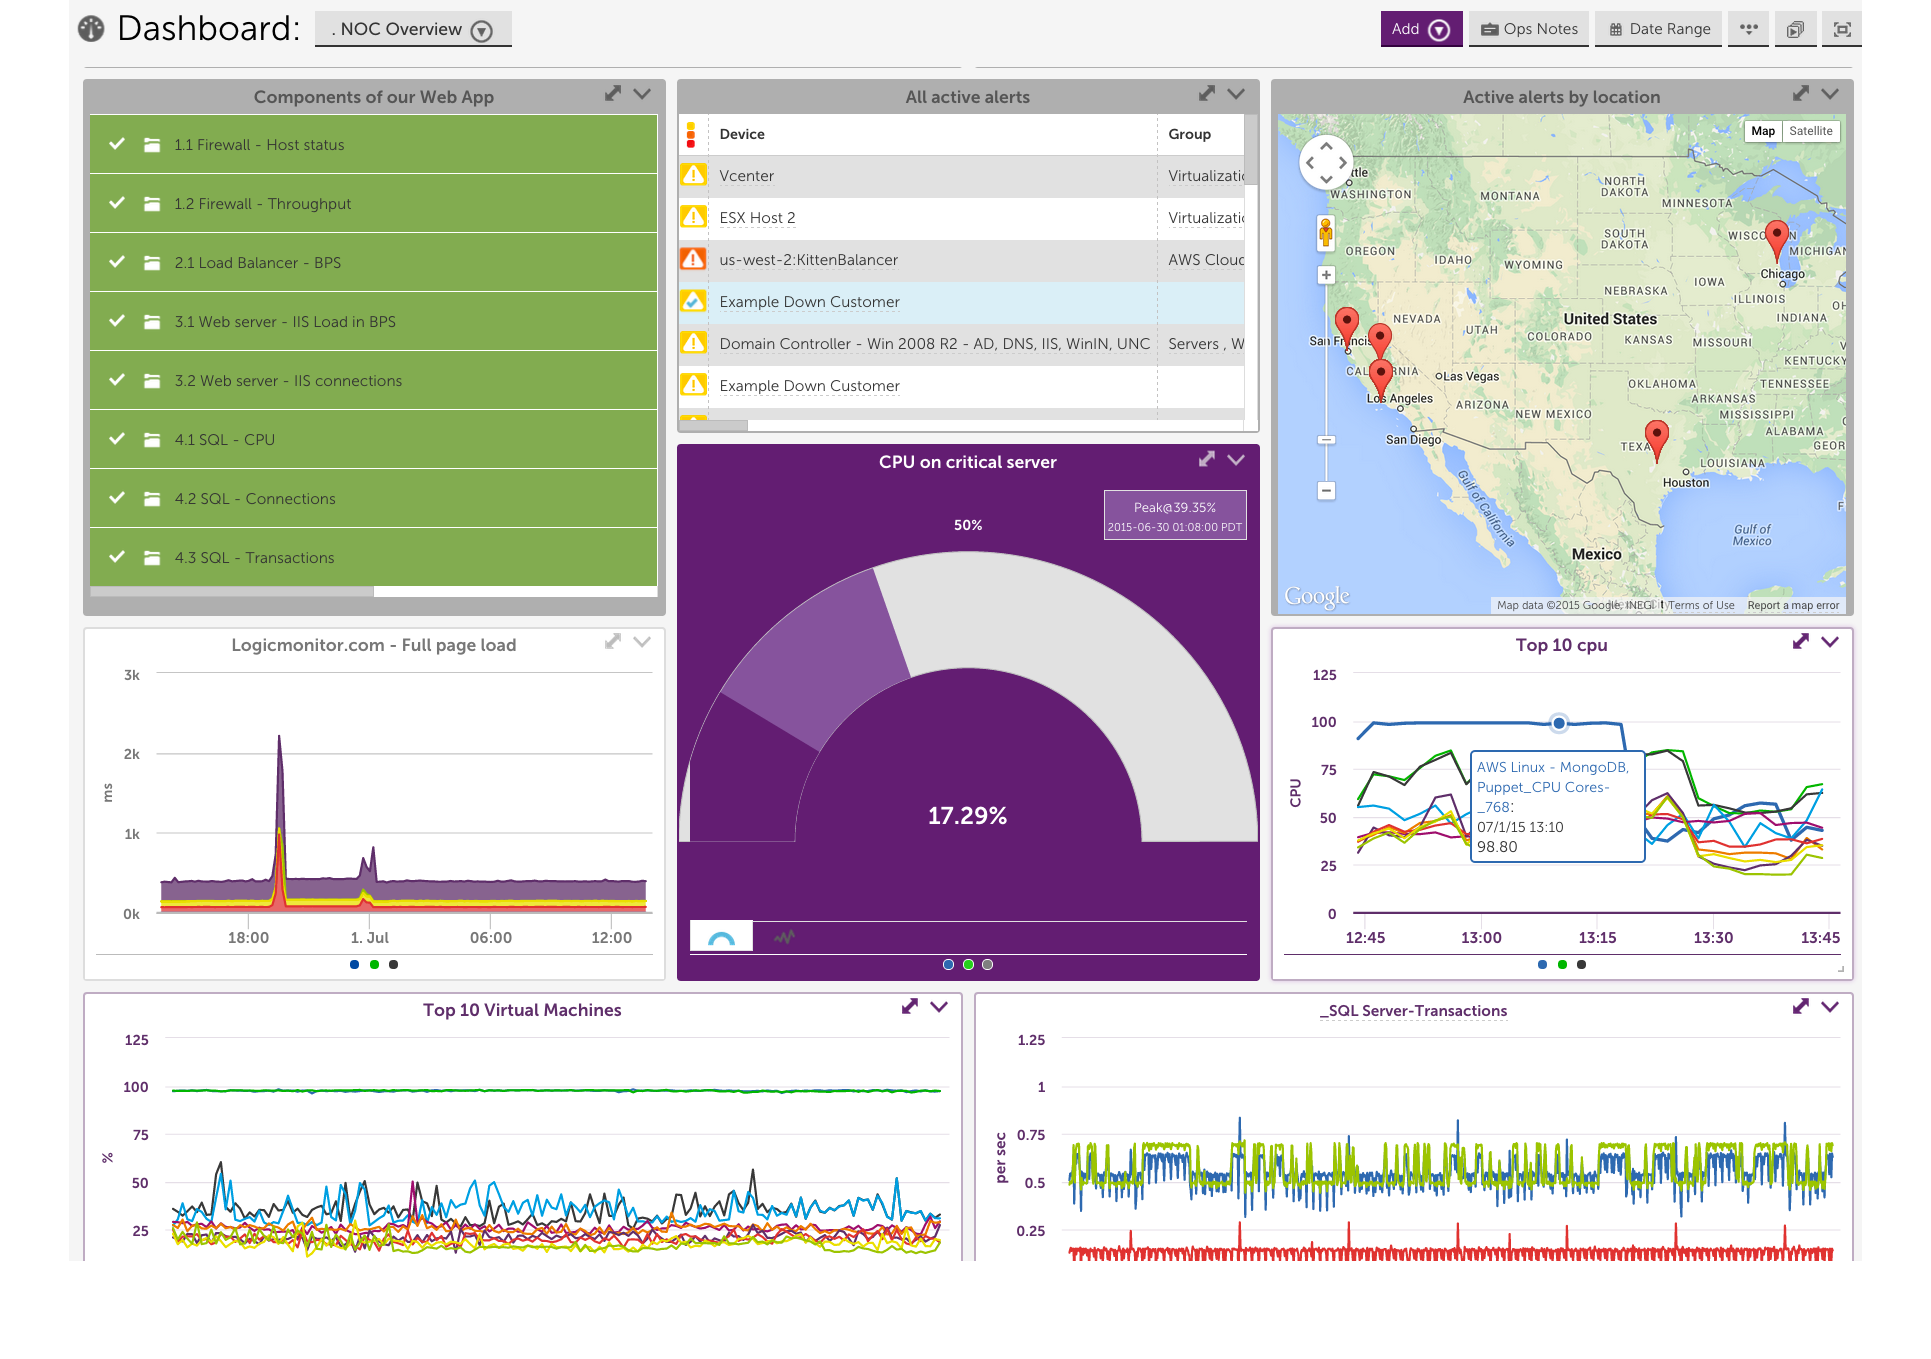
- NOC overview – Status of device groups, devices, and applications per location
- Virtualization – Perfomance metrics and alert status of virtual machines
Displaying Dashboards
Dashboards can be:
- Viewed within the LogicMonitor account by users with view or manage permissions.
- Displayed on an auto-rotate cycle (slide show).
- Shared as a read-only web page. See Sharing and Exporting/Importing Dashboards for more information on sharing dashboard URLs.
Tutorial
The following video provides a general overview of dashboards and widgets.