
ESX Data Collection
Last updated on 20 January, 2020The ESX collector allows you query data via the VMWare API. When adding or editing a datapoint using the ESX collector, you will see a dialog window similar to the one shown next.
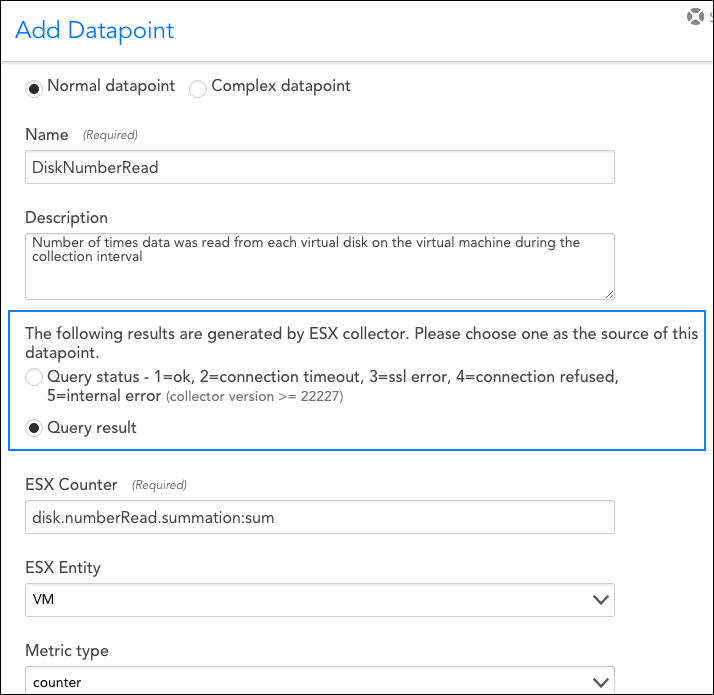
As highlighted in the above screenshot and discussed next, the ESX collector generates two types of results. You’ll need to choose one of these as the source for your datapoint.
Query Status
When selected, the Query status option returns vCenter status. This allows the DataSource to identify the source of an inaccessible VM, whether the issue stems from the VM itself or vCenter.
The following response statuses may be returned:
- 1=ok
- 2=connection timeout (or failed login due to incorrect user name or password (Collector versions 26.300 or earlier))
- 3=ssl error
- 4=connection refused
- 5=internal error
- 6=failed login due to incorrect user name or password (Collection versions 26.400 or later)
Note: You must have Collector version 22.227 or later to use the Query status option.
Query Result
When selected, the Query result option returns the raw response of the ESX counter you designate in the following ESX Counter field. The counter to be queried must be one of the valid ESX counters supported by the API. (See vSphere documentation for more information on supported ESX counters.)
As shown in the previous screenshot, a LogicMonitor specific aggregation method can be appended to the counter API object name in the Counter field. Two aggregation methods are supported:
- :sum
Normally, the ESX API will return the average of summation counters for multiple objects when queried against a virtual machine. When “:sum” is appended, LogicMonitor will alternately collect the sum. For example, using the counter shown in the above screenshot, a virtual machine with two disks, reporting 20 and 40 reads per second respectively, would return 60 reads per second for the virtual machine, rather than 30 reads per second. - :average
Because the summation of counters is not always the average of counters, LogicMonitor also supports “:average” as an aggregation method. For example, the cpu.usagemhz.average counter would normally return the sum of the averages for multiple objects for the collection interval. When “:average” is appended, LogicMonitor will divide this sum by the number of instances in order to return an average.
For more general information on datapoints, see Datapoint Overview.
Note: There is a known bug in VMware’s vSphere 4. Once there has been a change in freespace of datastores, it may take up to 5 minutes for this change to be reflected in your display. Read more about this bug and potential work-arounds here.