
Script Troubleshooting
Last updated on 20 March, 2023Scripting Best Practices
LogicMonitor’s scripting features provide for powerful extensibility of your monitoring, but as they say: with great power comes great responsibility. To ensure your scripts run trouble-free, keep the following best practices in mind:
- Because LogicMonitor scripts are run by your Collector, they’re limited by the overall horsepower in that system. As such, they should be designed to be as lightweight as possible.
- DataSource collection scripts, which are run once per poll, should complete within 1m to ensure data can be processed within the polling interval.
- When developing new script-based monitoring, you may want to install a new Collector to use as a sandbox environment. This will ensure your script development has no chance of interfering with production operations.
Developing Scripts with the Collector Debug Facility
Before installing your monitoring script into the appropriate LogicModule, you’ll first want to test it to make sure it’s behaving as designed. For an external script, this is straightforward, as you’ll typically develop and test directly on a Collector host by directly calling the appropriate interpreter for your script language.
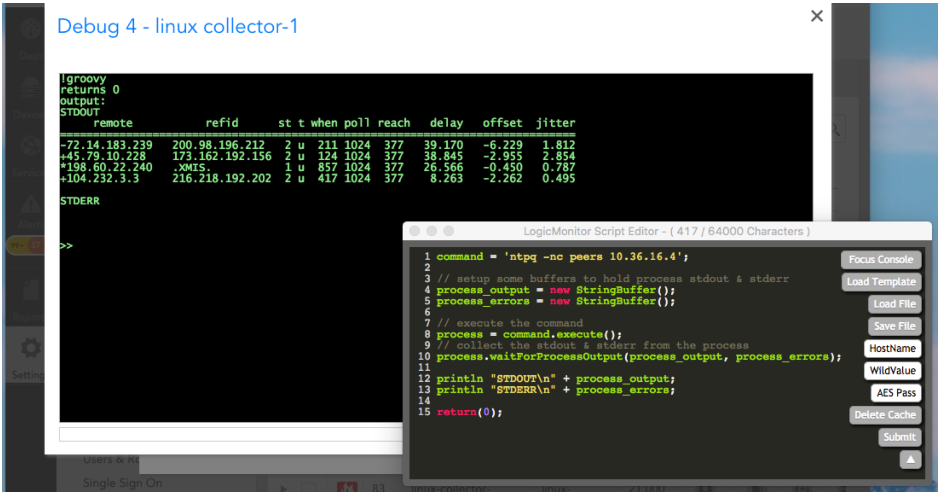
For embedded Groovy or PowerShell scripts, you can develop and test your scripts directly within LogicMonitor using the Collector Debug Facility. Although you can comprehensively debug with this built-in tool, we strongly recommend augmenting it with the LogicMonitor Script Debug Helper extension for the Google Chrome browser.
Regardless of whether you’re using the Collector Debug Facility or LogicMonitor Script Debug Helper, you’re able to author and debug your Groovy and PowerShell scripts on-the-fly using the !groovy and !posh debug commands.
Either of these commands will launch a text area in which you can write script code, iteratively test your code by submitting it to the Collector’s Groovy/PowerShell script interpreter, and view its output.
Once your code does what you want it to do (e.g. generate DataSource active discovery records or key/value pairs; EventSource JSON; ConfigSource configs; or some other meaningful output), you can copy it into the appropriate LogicModule.
Limitations of Collector Versions Below 28.300
If running a Collector version that is numbered lower than 28.300, you’ll need to hard-code any variables based on device properties. For example, if you intend for a script to dynamically get the hostname against which it should run, you’d use:
- Groovy:
hostname = hostProps.get("system.hostname"); - PowerShell:
$hostname = "##system.hostname##";
When running this code in a debug window, you’ll need to hard-code these variables to match the device against which you’re developing.
Note: For Collector version 28.300 (or higher numbered versions), host-level properties are pulled in automatically, just like they would be if the script was running in the Collector, as opposed to a debug window.
Diagnosing Scripts with Output Logging
Once a script has been applied to a particular LogicModule, it is run by the Collector as part of its device polling monitoring activities. This makes its operation somewhat opaque, which is challenging when you want to know why a script isn’t behaving as expected.
To make script operations more transparent, you’ll need to enable debug logging on the Collector. Upon doing so, the Collector will enable the writing of script output and errors to individual files in the Collector logs directory. Meaning: every time a script component is run by the Collector, both the STDOUT and STDERR from those processes are written to individual files. To prevent filling the Collector with debug files, each subsequent run of a Collector script overwrites the previous generation of the output and error files.
To enable script output logging, open the Collector’s log settings and set the collector.script component to “debug.” (For more information on adjusting Collector log levels, see Collector Logging.) Upon restart, the Collector will generate log files in either:
- Linux: /usr/local/logicmonitor/agent/logs
- Windows: C:\Program Files (x86)\LogicMonitor\Agent\logs
When you’ve completed debugging, we recommend disabling script output logging by returning the Collector log setting to the default of “info.”