Using Ops Notes
Last updated on 24 March, 2020Ops Notes allow you to add time stamped annotations (i.e. markers) to your graphs. This is a powerful way to correlate events – be it manual device changes, upgrades, or releases- with performance changes in your environment. Not only is this useful for troubleshooting purposes, but it provides a historical log of events’ impact on your environment’s performance.
Adding Ops Notes
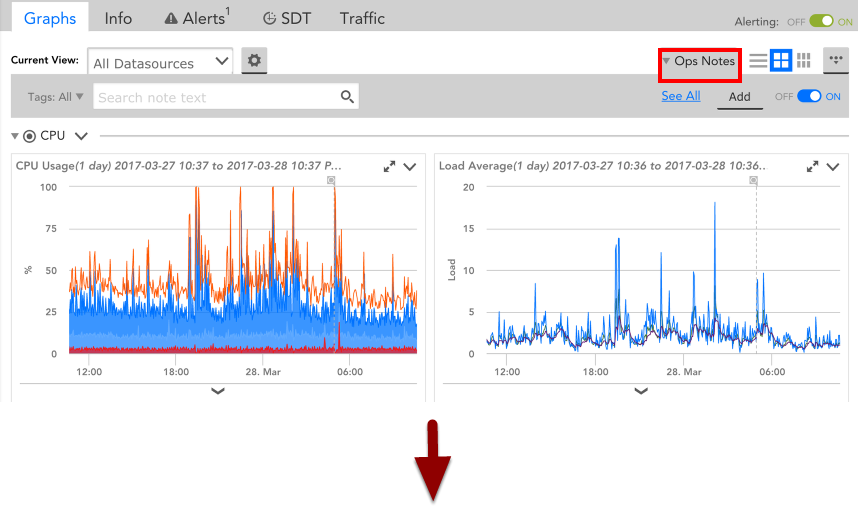
Ops Notes are available only to administrators (with rights to manage all devices). If you have sufficient privileges, you’ll see the Ops Notes button in the top right panel of the Devices and Dashboards tabs.
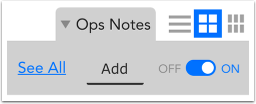
Selecting the “Ops Notes” button will reveal a new menu from which you can add new Ops Notes graph markers, view all previously created Ops Notes, as well as search created Ops Notes based on their associated tags and content.
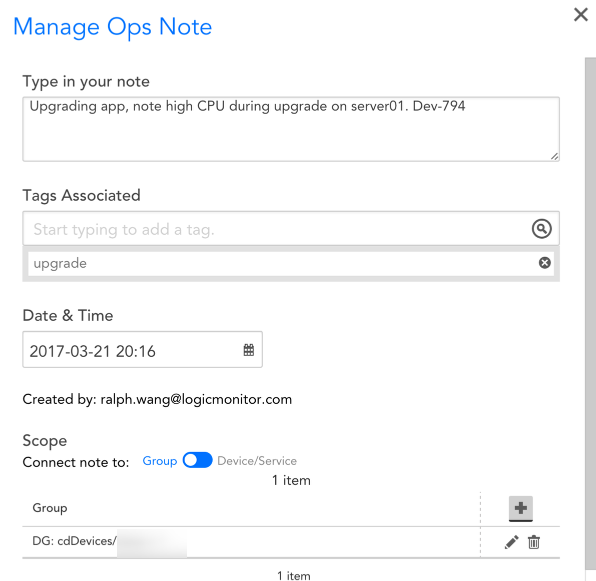
Type in your note
The content that will display in your Ops Notes. You should include all relevant information necessary to contextualize the event.
Tags Associated
The tags associated with the Ops Note. Tags can be the name of a device, group, dashboard, DataSource, instance or any string.
We highly recommend included tags based on event type (ie. bug, deployment, upgrade, manual changes, etc). Because tags are searchable, tagging Ops Notes based on event type provides a good historical log the will contextualize how certain actions impact your environment
Date and Time
The date and time associated with the Ops Note.
Scope
The Scope toggle determines all the devices/device groups to which the Ops Note will be applied. If the toggle is shifted to Group, then the Ops Note will appear on all graphs of all devices within the specified group(s). If the toggle is shifted to Device/Service. then the Ops Note will only appear on graphs associated with the designated device or service.
Limiting the scope of Ops Notes ensures that they only are associated with data that correlates to the event they represent.
Viewing Ops Notes
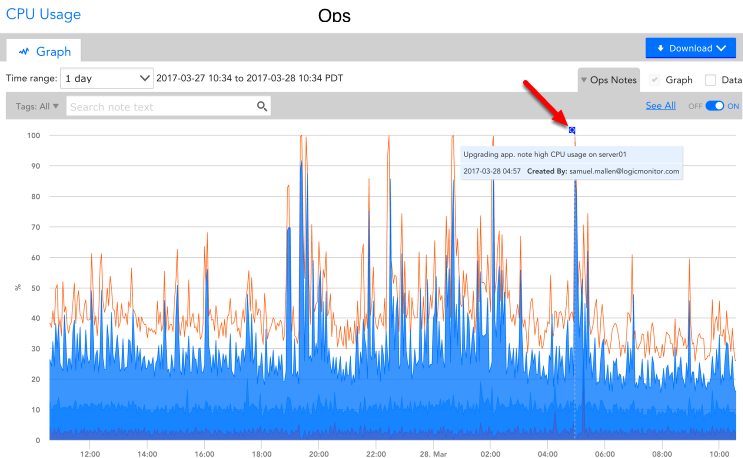
Once added, Ops Notes will display as markers on all Dashboards and device graphs associated with the designated Devices, Services, or device groups. A searchable list of all Ops Notes will be displayed when you click the Ops Notes button and select “See All.”
From the Ops Notes table, you can search created Ops Notes based on time range, device/service, group, tags, or note content. This makes it easy to filter through all your past Ops Notes to find data specific to an event or device.
It should be noted that while all Ops Notes can be viewed in the Ops Notes table, a maximum number of 50 Ops Notes can be displayed at a given time in a graph. As such, when viewing a graph with a long time range, older Ops Notes may be suppressed if more than 50 have been created within that time period.

Show/Hide All
This Off/On toggle located by Ops Notes will determine whether or not Ops Notes are displayed. Note that this toggle setting will apply to all devices/services, groups, and dashboards across your account.