
Enabling Dependent Alert Mapping
Last updated on 15 March, 2024FEATURE AVAILABILITY: Dependent Alert Mapping is available to users of LogicMonitor Enterprise.
Overview
Dependent Alert Mapping leverages the auto-discovered relationships among your monitored resources, as discovered by LogicMonitor’s topology mapping AIOps feature, to determine the root cause of an incident that is impacting dependent resources.
When enabled for your alerting operations, Dependent Alert Mapping highlights the originating cause of the incident, while optionally suppressing notification routing for those alerts determined to be dependent on the originating alert. This can significantly reduce alert noise for events in which a parent resource has gone down or become unreachable, thus causing dependent resources to go into alert as well.
How Dependent Alert Mapping Works
During an alert storm, many alerts relating to the same originating incident are raised in LogicMonitor and a slew of notifications may be sent out based on alert rule settings for each metric threshold that is exceeded. This can result in a flood of notifications for resources affected by the incident without a clear indication of which resources are the root cause of the incident.
Enabling Dependent Alert Mapping addresses this issue through the following process:
- Identifying unreachable alerts for resources in a dependency chain. Dependent Alert Mapping is based on topology relationships. If a resource that is part of an identified dependency chain goes down or becomes unreachable, its alerts are flagged for Dependent Alert Mapping. A resource is considered down or unreachable when an alert of any severity level is raised for it by the PingLossPercent or idleInterval datapoints, which are associated with the Ping and HostStatus DataSources respectively.
- Delaying routing of alert notifications (optional). When a resource in the dependency chain goes down or becomes unreachable, this first “reachability” alert triggers all resources in the chain to enter a delayed notification state. This state prevents immediate routing of alert notifications and provides time for the incident to fully manifest and for the Dependent Alert Mapping algorithm to determine the originating and dependent causes.
- Adding dependency role metadata to alerts. Any resource in the dependency chain with a reachability alert is then identified as a parent node or suppressing node to its dependent child or suppressed nodes. This process adds metadata to the alert identifying the alert’s dependency role as either originating or dependent. This role provides the data needed for suppressing dependent alert notifications.
- Suppressing routing of alert notifications (optional). Those alerts identified as dependent are not routed, thus reducing alert noise to just those alerts that identify originating causes. (Dependent alerts still display in the LogicMonitor interface; only notification routing is suppressed.)
- Clearing of alerts across dependency chain. When the originating reachability alerts begin to clear, all resources in the dependency chain are once again placed into a delayed notification state to allow time for the entire incident to clear. After five minutes, any remaining alerts will then be routed for notification or, if some resources are still unreachable, a new Dependent Alert Mapping incident is initiated for these devices and the process repeats itself.
Requirements for Dependent Alert Mapping
For dependent alert mapping to take place, the following requirements must be met.
Unreachable or Down Resource
To trigger dependent alert papping, a resource must be unreachable or down, as determined by an alert of any severity level being raised on the following datapoints:
- PingLossPercent (associated with the Ping DataSource)
- idleInterval (associated with the HostStatus DataSource)
Note: Dependent Alert Mapping is currently limited to resources and does not extend to instances. For example, a down interface on which other devices are dependent for connectivity will not trigger Dependent Alert Mapping.
Topology Prerequisite
Dependent Alert Mapping relies on the relationships between monitored resources. These relationships are automatically discovered via LogicMonitor’s topology mapping feature. To ensure this feature is enabled and up to date, see Topology Mapping Overview.
Performance Limits
Dependent Alert Mapping has the following performance limits:
- Default number of dependent nodes (total): 10,000 Devices
- Topology Connections used for Dependent Alert Mapping: Network, Compute, Routing.
- Topology Device ERT (predef.externalResourceType) excludes: VirtualInstances, AccessPoints, and Unknown.
Configuring Dependent Alert Mapping
Every set of Dependent Alert Mapping configurations you create is associated with one or more entry points. As discussed in detail in the Dependency Chain Entry Point section of this support article, an entry point is the resource at which the dependency chain begins (i.e. the highest level resource in the resulting dependency chain hierarchy); all resources connected to the entry-point resource become part of the dependency chain and are, therefore, subject to Dependent Alert Mapping if any device upstream or downstream in the dependency chain becomes unreachable.
The ability to configure different settings for different entry points provides considerable flexibility. For example, MSPs may have some clients that permit a notification delay but others that don’t due to strict SLAs. Or, an enterprise may want to route dependent alerts for some resources, but not for others.
To configure Dependent Alert Mapping, select Settings > Alert Settings > Dependent Alert Mapping | > Add. A dialog appears that allows you to configure various settings. Each setting is discussed next.
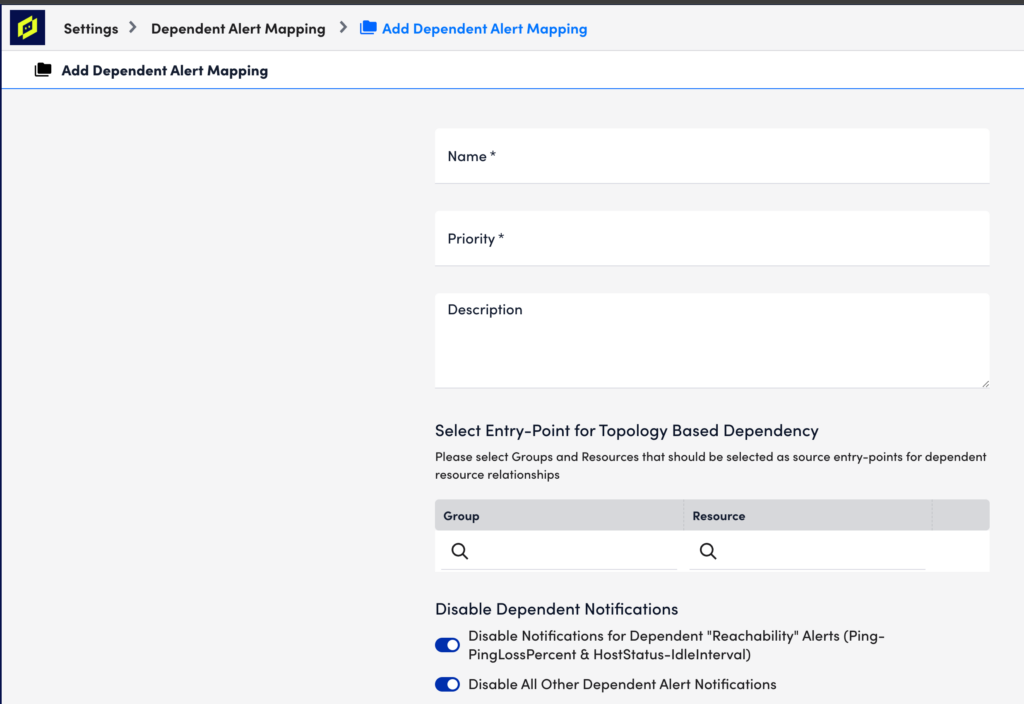
Name
In the Name field, enter a descriptive name for the configuration.
Priority
In the Priority field, enter a numeric priority value. A value of “1” represents the highest priority. If multiple configurations exist for the same resource, this field ensures that the highest priority configurations are used. If you are diligent about ensuring that your entry-point selections represent unique resources, then priority should never come into play. The value in this field will only be used if coverage for an entry point is duplicated in another configuration.
Description
In the Description field, optionally enter a description for the configuration.
Entry Point
Under the Select Entry-Point for Topology-Based Dependency configuration area, click the plus sign (+) icon to add one or more groups and/or individual resources that will serve as entry point(s) for this configuration. For either the Group or Resource field, you can enter a wildcard (*) to indicate all groups or all resources. Only one of these fields can contain a wildcard per entry point configuration. For example, selecting a resource group but leaving resources wildcarded will return all resources in the selected group as entry points.
The selection of an entry-point resource uses the topology relationships for this resource to establish a parent/child dependency hierarchy (i.e. dependency chain) for which Dependent Alert Mapping is enabled. If any resource in this dependency chain goes down, it will trigger Dependent Alert Mapping for all alerts arising from members of the dependency chain.
Once saved, all dependent nodes to the entry point, as well as their degrees of separation from the entry point, are recorded in the Audit Log, as discussed in the Dependent Alert Mapping Detail Captured by Audit Log section of this support article.
Note: The ability to configure a single set of Dependent Alert Mapping settings for multiple entry points means that you could conceivably cover your entire network with just one configuration.
Guidelines for Choosing an Entry Point
When possible, you should select the Collector host as the entry point. As the location from which monitoring initiates, it is the most accurate entry point. However, if your Collector host is not in monitoring or if its path to network devices is not discovered via topology mapping, then the closest device to the Collector host (i.e. the device that serves as the proxy or gateway into the network for Collector access) should be selected.
In a typical environment, you will want to create one entry point per Collector. The following diagrams offer guidelines for selecting these entry points.
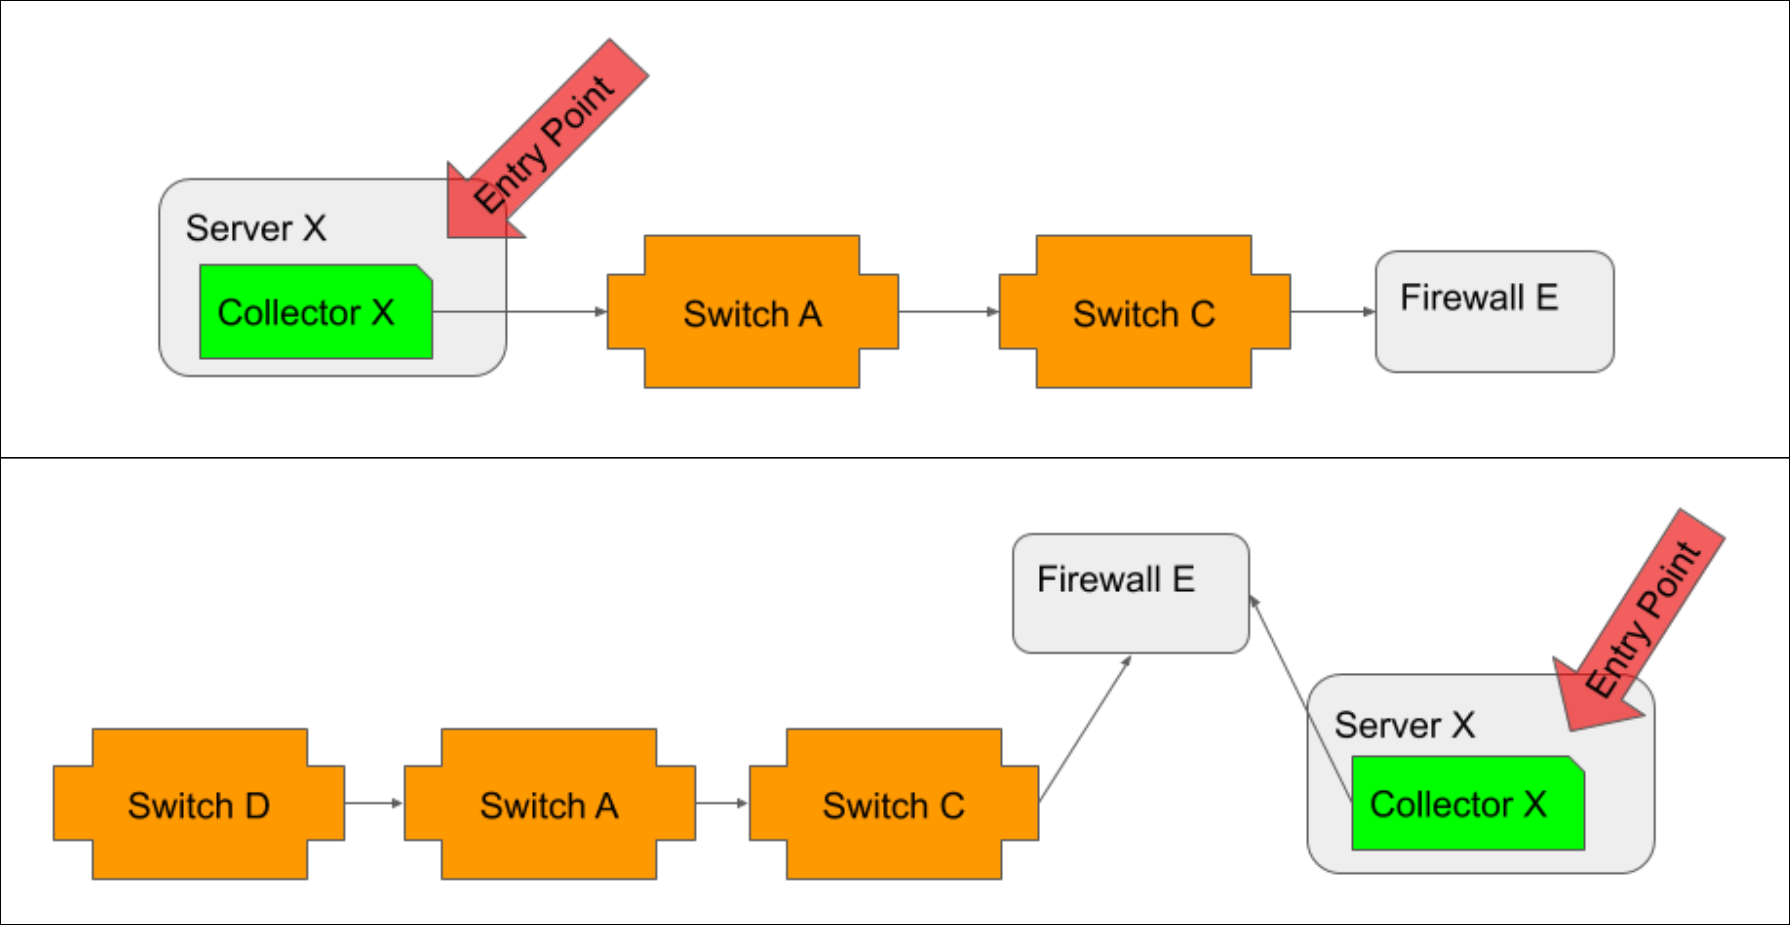
When the Collector host is monitored, and its path to network devices is discoverable via topology, it should be the entry point, regardless of whether it resides inside (illustrated in top example) or outside (illustrated in bottom example) the network.
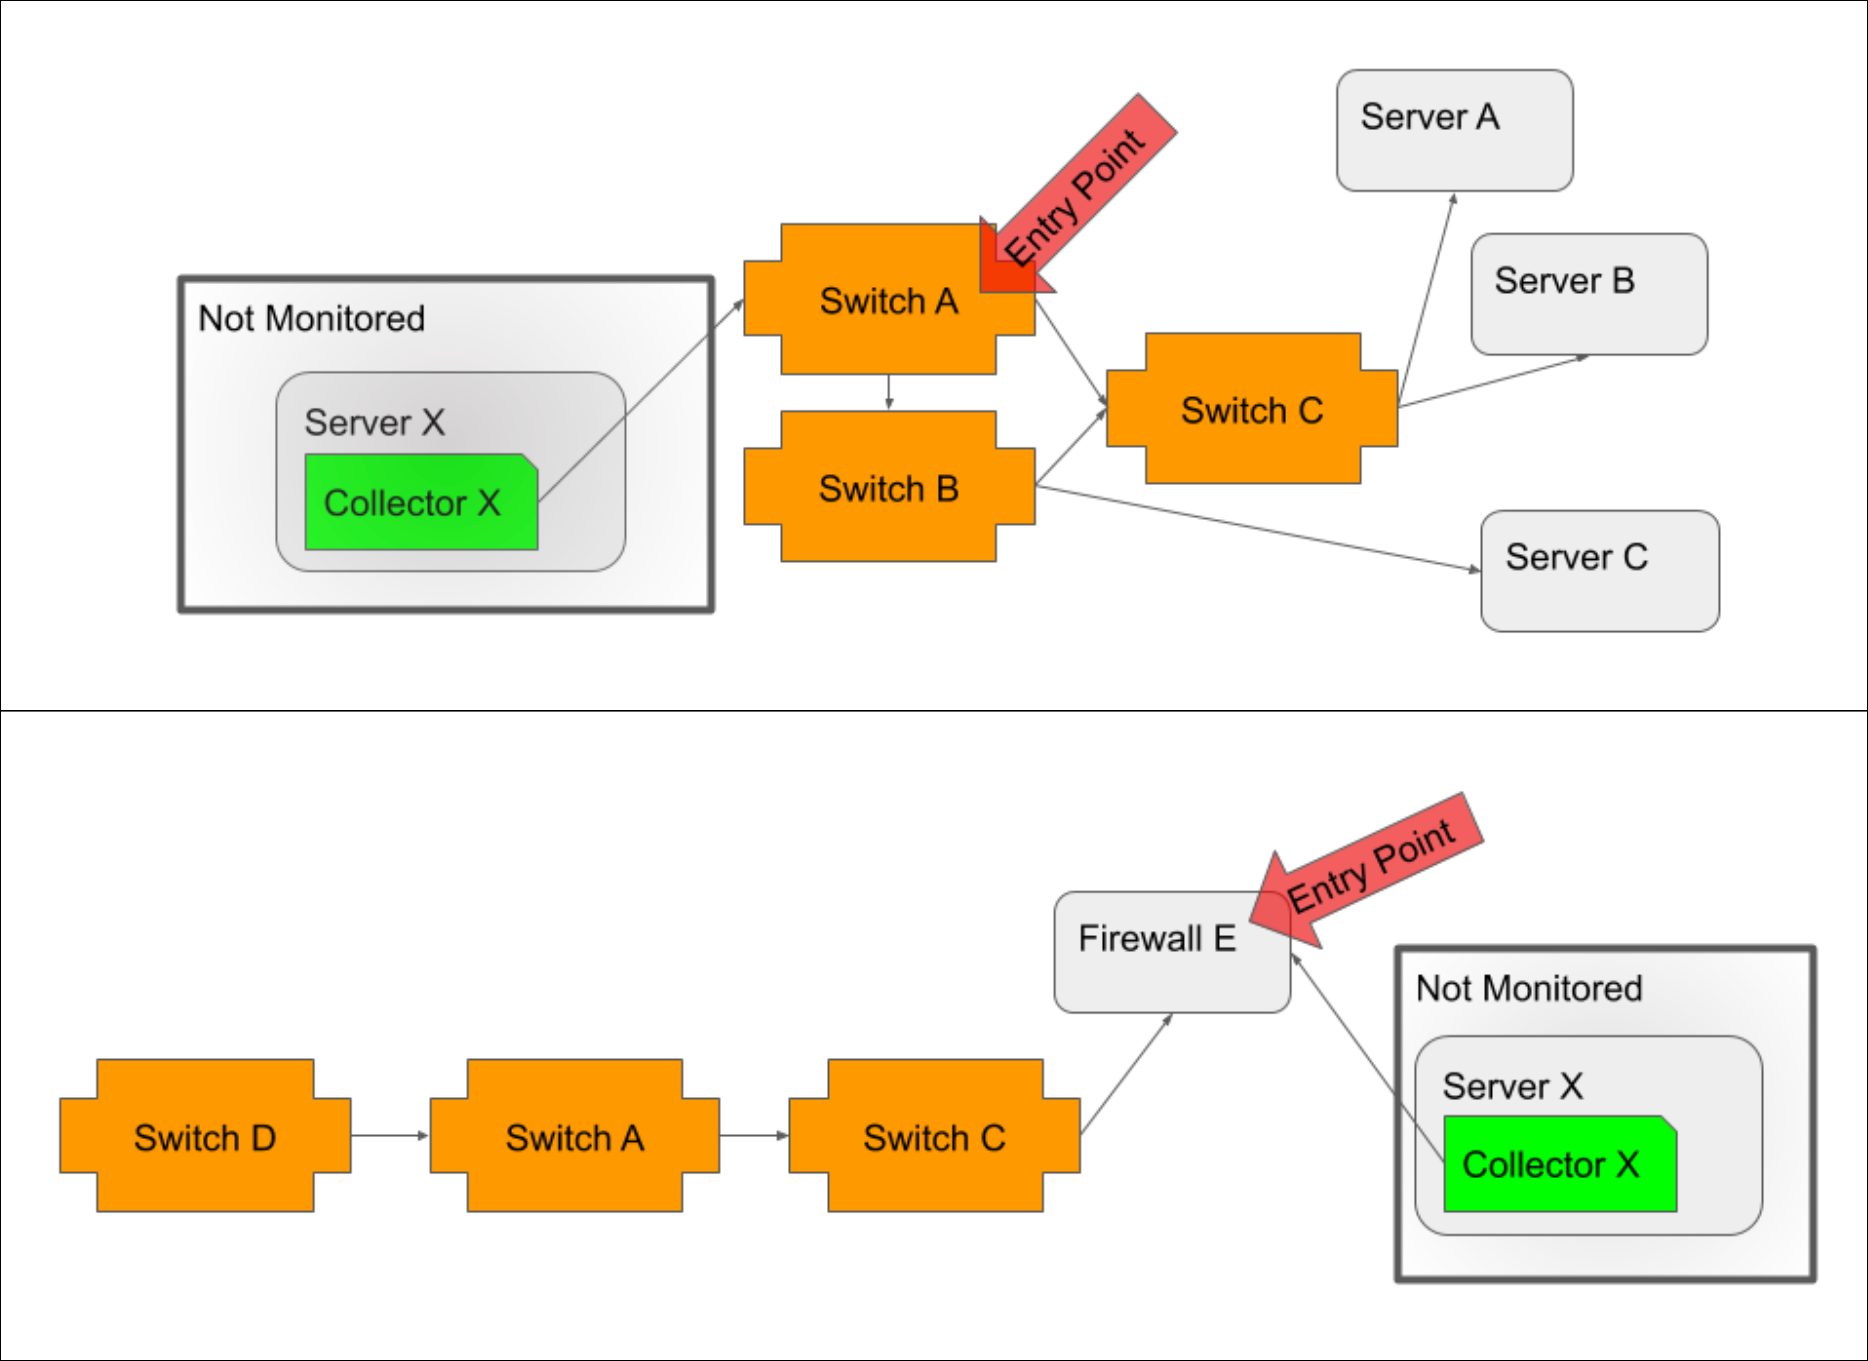
If the Collector host is not monitored, then the device closest to the Collector host, typically a switch/router if the host is inside the network (illustrated in top example) or a firewall if the host is outside the network (illustrated in bottom example), should be selected as the entry point.
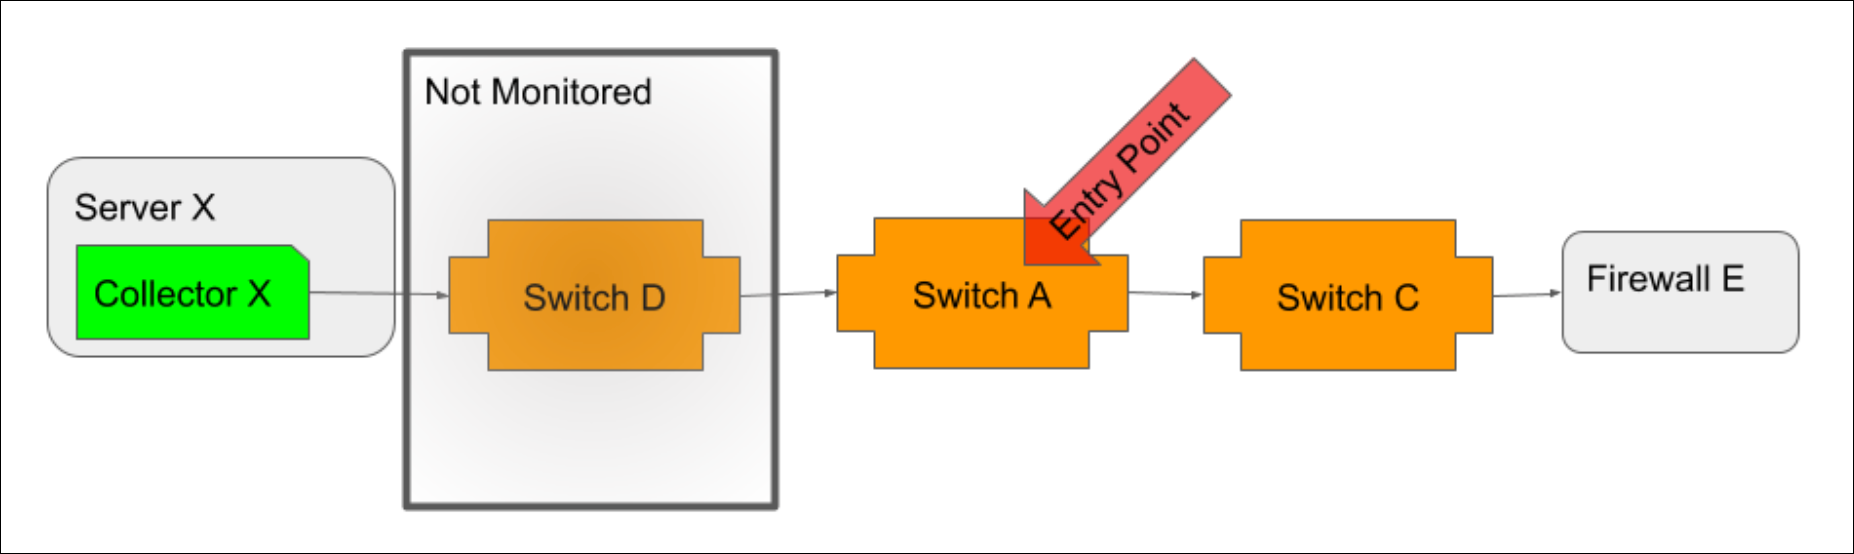
If the Collector host is monitored, but its path to network devices is not discoverable via topology, then the device closest to the Collector host that is both monitored and discovered should be selected as the entry point.
Note: To verify that topology relationships are appropriately discovered for the entry point you intend to use, open the entry point resource from the Resources page and view its Maps tab. Select “Dynamic” from the Context field’s dropdown menu to show connections with multiple degrees of separation. See Maps Tab.
Understanding the Resulting Dependency Chain
The selection of an entry-point resource establishes a dependency hierarchy in which every connected resource is dependent on the entry point as well as on any other connected resource that is closer than it is to the entry point. This means that the triggering of Dependent Alert Mapping is not reliant on just the entry point becoming unreachable and going into alert. Any node in the dependency chain that is unreachable and goes into alert (as determined by the PingLossPercent or idleInterval datapoints) will trigger Dependent Alert Mapping.
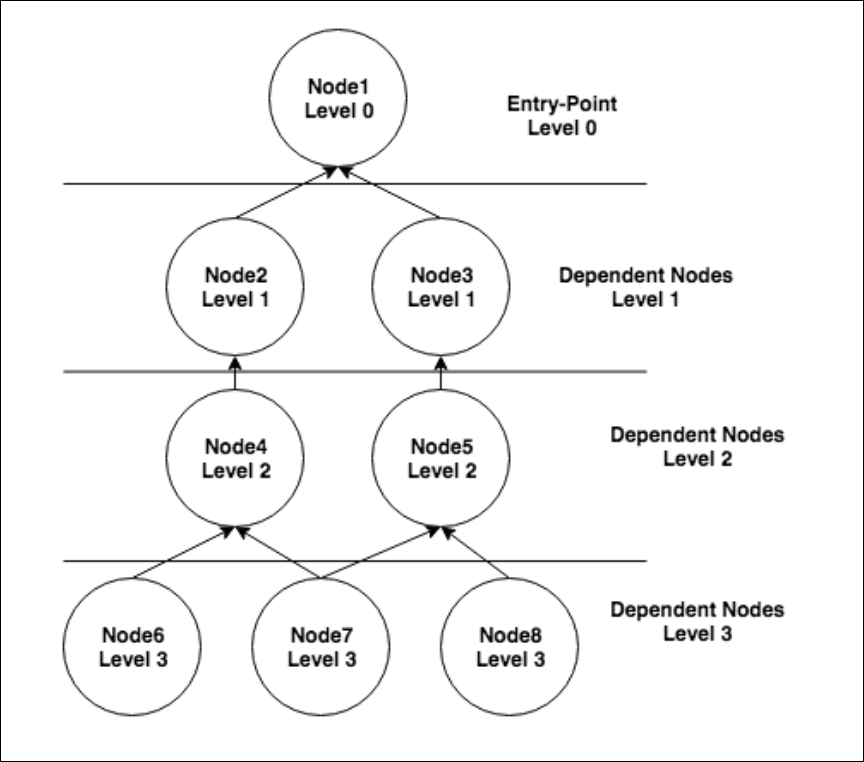
In this example dependency chain, node 1 is the entry point and nodes 2-8 are all dependent on node 1. But other dependencies are present as well. For example, if node 2 goes down and, as a result, nodes 4, 6 and 7 become unreachable, RCA would consider node 2 to be the originating cause of the alerts on nodes 4, 6 and 7. Node 2 would also be considered the direct cause of the alert on node 4. And node 4 would be considered the direct cause of the alerts on nodes 6 and 7. As discussed in the Alert Details Unique to Dependent Alert Mapping section of this support article, originating and direct cause resource(s) are displayed for every alert that is deemed to be dependent.
Disable Dependent Notifications
Use the following options to suppress notification routing for dependent alerts during a Dependent Alert Mapping incident:
- Disable Notifications for Dependent “Reachability” Alerts (Ping-PingLossPercent & HostStatus-IdleInterval). When checked, this option disables alert notifications for dependent alerts triggered by either the PingLossPercent (associated with the Ping DataSource) or idleInterval (associated with the HostStatus DataSource) datapoints.
- Disable All Other Dependent Alert Notifications. When checked, this option also serves to disable routing for dependent alerts, but not if those dependent alerts are the result of the resource being down or unreachable (as determined by the PingLossPercent or idleInterval datapoints). In other words, notifications for dependent alerts that are triggered by datapoints other than PingLossPercent or idleInterval are suppressed; notifications for dependent alerts that are triggered by PingLossPercent or idleInterval are released for routing.
Most likely, you’ll want to check both options to suppress all dependent alert routing and release only those alerts determined to represent the originating cause. However, for more nuanced control, you can disable only reachability alerts—or only non-reachability alerts. This may prove helpful in cases where different teams are responsible for addressing different types of alerts.
Note: If you want to verify the accuracy of originating and dependent alert identification before taking the potentially risky step of suppressing alert notifications, leave both of these options unchecked to begin with. Then, use the root cause detail that is provided in the alert, as discussed in the Alert Details Unique to Dependent Alert Mapping section of this support article, to ensure that the outcome of Dependent Alert Mapping is as expected.
Routing Delay
By default, the Enable Alert Routing Delay option is checked. This delays alert notification routing for all resources that are part of the dependency chain when an alert triggers Dependent Alert Mapping, allowing time for the incident to fully manifest itself and for the algorithm to determine originating cause and dependent alerts. As discussed in the Viewing Dependent Alerts section of this support article, an alert’s routing stage will indicate “Delayed” while root cause conditions are being evaluated.
If routing delay is enabled, the Max Alert Routing Delay Time field is available. This field determines the maximum amount of time alert routing can be delayed due to Dependent Alert Mapping.
If evaluation is still occurring when the maximum time limit is reached (or if the Enable Alert Routing Delay option is unchecked), notifications will be routed with whatever Dependent Alert Mapping data is available at that time. In the event of no delay being permitted, this will likely mean that no root cause data will be included in the notifications. However, in both cases, as the incident manifests, the alerts will continue to evolve which will result in additional information being added to the alerts and, in the case of those alerts determined to be dependent, suppression of additional escalation chain stages.
Note: Reachability or down alerts for entry point resources are always routed immediately, regardless of settings. This is because an entry-point resource will always be the originating cause, making it an actionable alert and cause for immediate notification.
Viewing Dependent Alerts
Alerts that undergo Dependent Alert Mapping display as usual in the LogicMonitor interface—even those whose notifications have been suppressed as a result of being identified as dependent alerts. As discussed in the following sections, the Alerts page offers additional information and display options for alerts that undergo Dependent Alert Mapping.
Columns and Filters Unique to Dependent Alert Mapping
The Alerts page offers three columns and two filters unique to the Dependent Alert Mapping feature.
Note: The values reported in the Dependent Alert Mapping columns will only display when an alert is active. Once it clears, the values within the column will clear, while the original Dependent Alert Mapping metadata will remain in the original alert message.
Routing State Column
The Routing State column displays the current state of the alert notification. There are three possible routing states:
- Delayed. A “Delayed” routing state indicates that the dependency role of the alert is still being evaluated and, therefore, the alert has not yet been released for routing notification.
- Suppressed. A “Suppressed” routing state indicates that no subsequent alert notification was routed for the alert because it was determined to be dependent and met the notification disabling criteria set for the Dependent Alert Mapping configuration.
- Normal. A “Normal” routing state indicates that the alert notification was released for standard routing as specified by alert rules.
Dependency Role Column
The Dependency Role column displays the role of the alert in the incident. There are three possible dependency roles:
- TBD. A “TBD” dependency role indicates that the incident is still being evaluated and dependency has not yet been determined.
- Originating. An “Originating” dependency role indicates that the alert represents the resource that is the root cause (or one of the root causes) of the incident.
- Dependent. A “Dependent” dependency role indicates that the alert is the result of another alert, and not itself representative of root cause.
Dependent Alerts Column
The Dependent Alerts column displays the number of alerts, if any, that are dependent on the alert. If the alert is an originating alert, this number will encompass all alerts from all resources in the dependency chain. If the alert is not an originating alert, it could still have dependent alerts because any alert that represents resources downstream in the dependency chain is considered to be dependent on the current alert.
Routing State and Dependency Role Filters
LogicMonitor offers two filters based on the data in the Routing State and Dependency Role columns. The criteria for these filters lines up with the values available for each column.
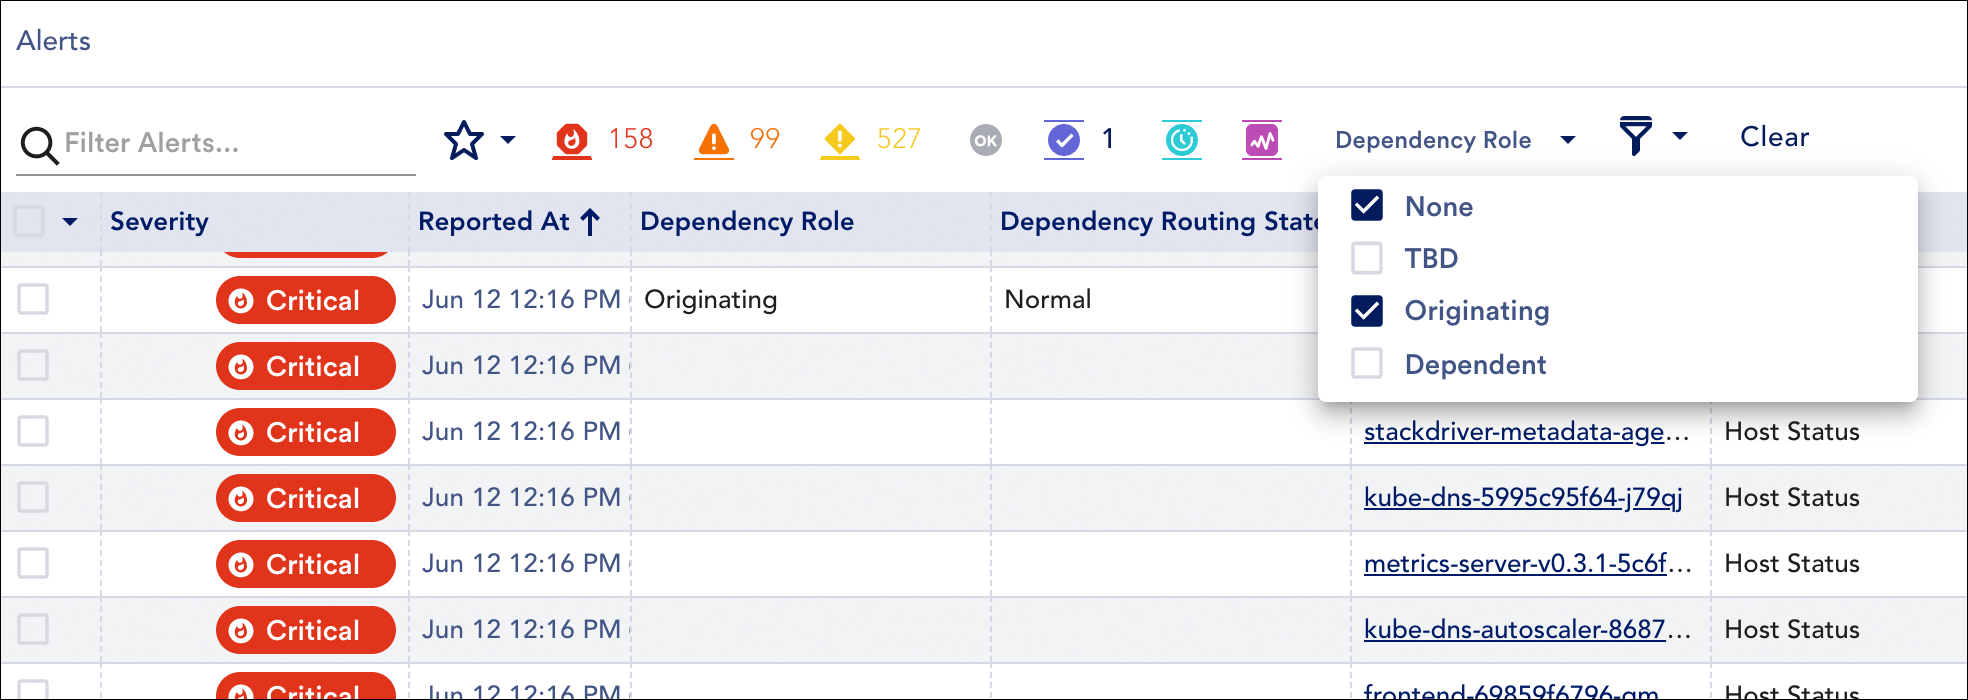
Dependent Alert Mapping algorithm as well as all other alerts across your portal that were never assigned a dependency role (i.e. they didn’t undergo
Dependent Alert Mapping).
Dependencies Tab
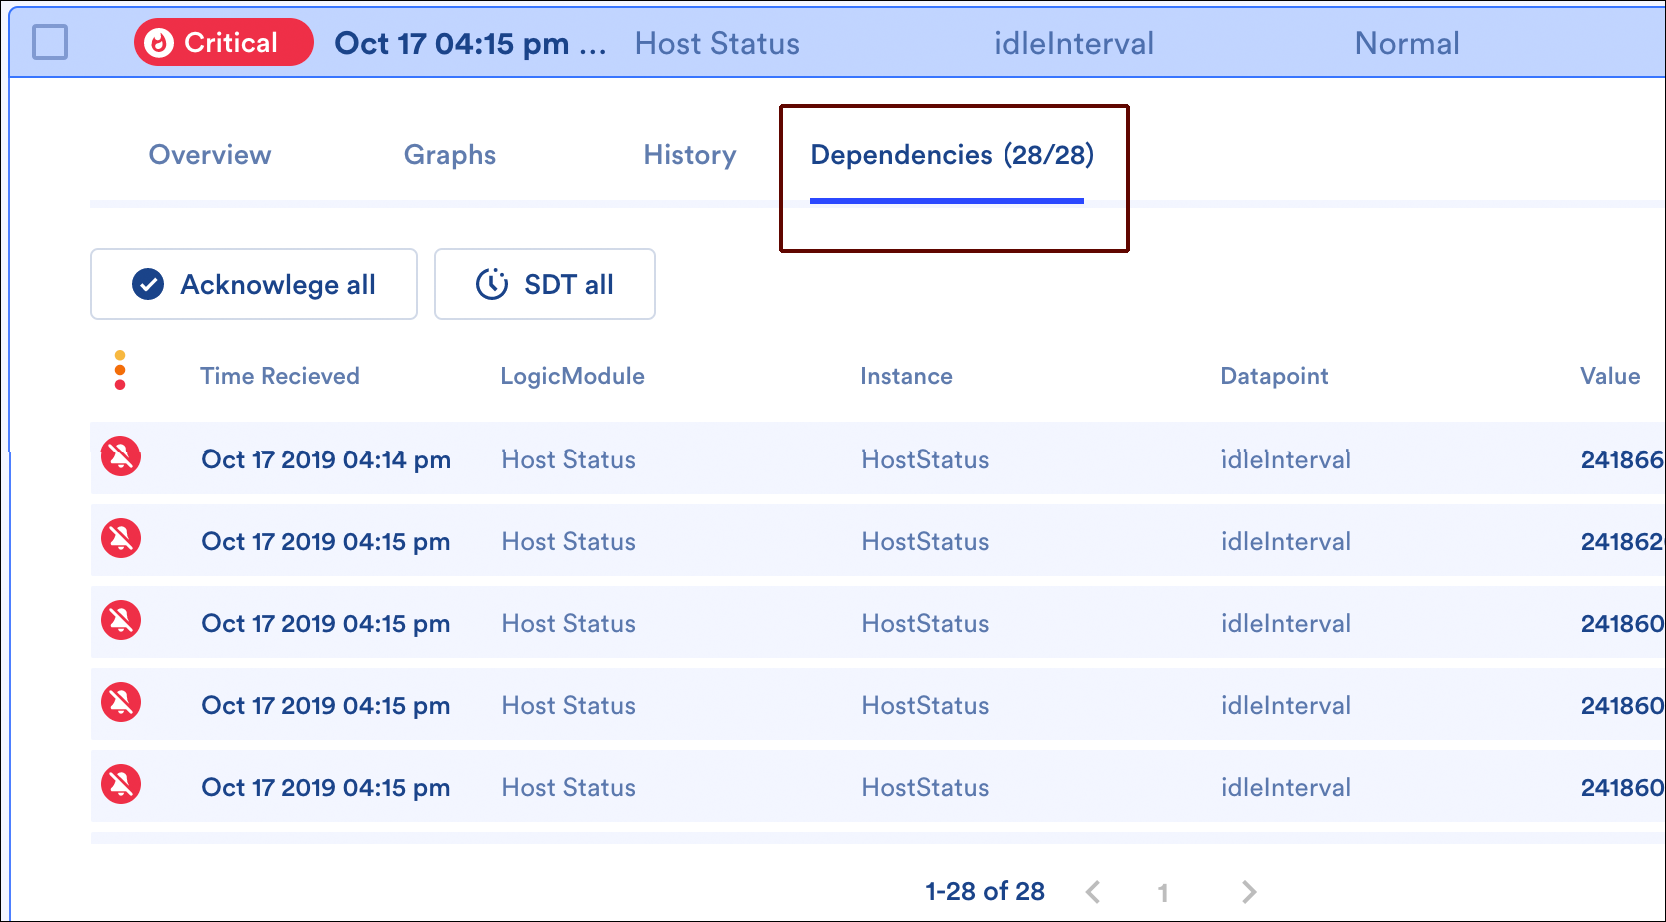
When viewing the details of an alert with dependent alerts (i.e. an originating cause alert or direct cause alert), a Dependencies tab is additionally available. This tab lists all of the alert’s dependent alerts (i.e. all alerts for resources downstream in the dependency chain). These dependent alerts can be acknowledged or placed into scheduled downtime (SDT) en masse using the Acknowledge all and SDT all buttons.
Alert Details Unique to Dependent Alert Mapping
The alert details for an alert that is part of a Dependent Alert Mapping incident carry additional details related to the root cause—these details are present in both the LogicMonitor UI and alert notifications (if routed).
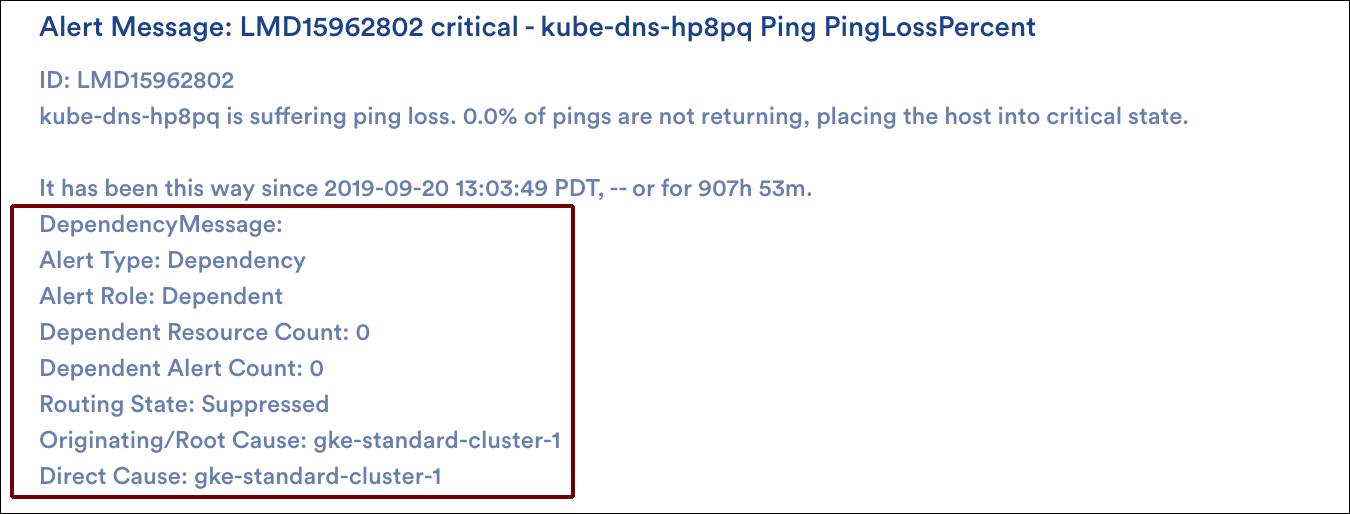
The alert type, alert role, and dependent alert count carry the same details as the columns described in a previous section. If the alert is not the originating alert, then the originating cause and direct cause resource names are also provided. Direct cause resources are the immediate neighbor resources that are one step closer to the entry point on which the given resource is directly dependent.
Dependent Alert Mapping details are also available as tokens. For more information on using tokens in custom alert notification messages, see Tokens Available in LogicModule Alert Messages.
- ##DEPENDENCYMESSAGE##
Represents all dependency details that accompany alerts that have undergone Dependent Alert Mapping
- ##ALERTDEPENDENCYROLE##
- ##DEPENDENTRESOURCECOUNT##
- ##DEPENDENTALERTCOUNT##
- ##ROUTINGSTATE##
- ##ORIGINATINGCAUSE##
- ##DIRECTCAUSE##
Dependent Alert Mapping Detail Captured by Audit Log
Approximately five minutes after saving a Dependent Alert Mapping configuration, the following information is captured in LogicMonitor’s audit logs for the “System:AlertDependency” user:
Entry Point(type:name(id):status:level:waitingStartTime):
Nodes In Dependency(type:name(id):status:level:waitingStartTime:EntryPoint):
Where:
- status (of the node or entry point) is Normal|WaitingCorrelation|Suppressing|Suppressed|WaitingClear
- level is the number of steps the node is removed from the entry point (always a value of 0 for the entry point)
- waitingStartTime is the start of delay if node is in a status state of “WaitingCorrelation”
For more information on using the audit logs, see About Audit Logs.
Modeling the Dependency Chain
Using the entry point and dependent nodes detail captured by the audit logs (as discussed in the previous section), you may want to consider building out a topology map that represents the entry point(s) and dependent nodes of your Dependent Alert Mapping configuration. Because topology maps visually show alert status, this can be extremely helpful when evaluating an incident at a glance. For more information on creating topology maps, see Mapping Page.
Role-Based Access Control
Like many other features in the LogicMonitor platform, Dependent Alert Mapping supports role-based access control. By default, only users assigned the default administrator or manager roles will be able to view or manage Dependent Alert Mapping configurations. However, as discussed in Roles, roles can be created or updated to allow for access to these configurations.