
About LM™ Service Insight
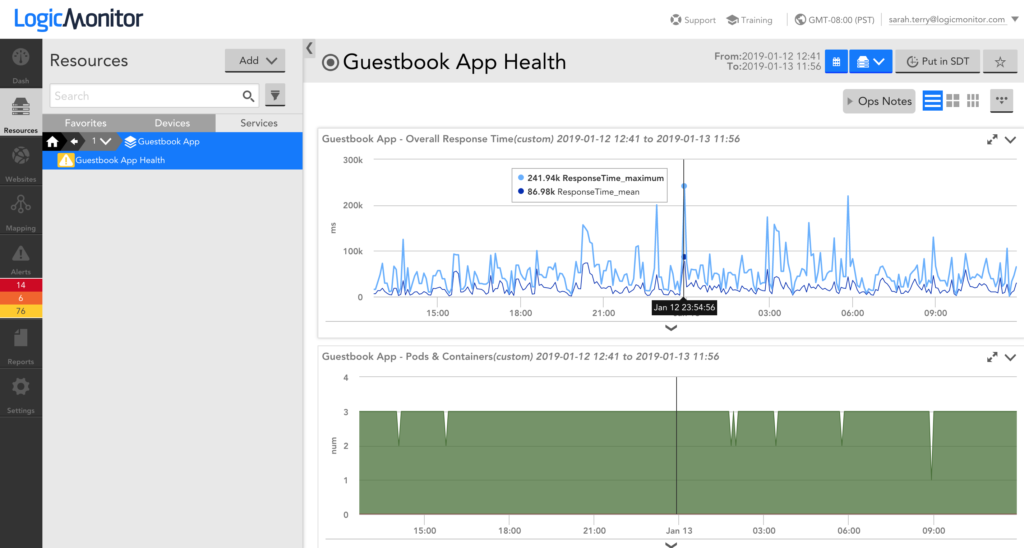
Last updated on 12 August, 2022LM™ Service Insight enables you to group together instances across one or more monitored resources (e.g. devices) into a logical “Service”, aggregate service level indicators across these instances to obtain service level data, and monitor, visualize, and alert on this service level data. You may find this service-level monitoring and alerting useful when the health of overall services is a higher priority than the health of individual monitored devices. For example, you may use LM™ Service Insight to monitor an application running across many containers, where an individual, ephemeral, containerized application instance is not necessarily indicative of overall application performance.
How does LM™ Service Insight work?
LM™ Service Insight is based on a new LogicMonitor resource type, Services. Services comprise of instances across one or more monitored devices. DataSources with a collection method of ‘Aggregate data’ are applied to Services, and the datapoints within these DataSources specify what data should be aggregated and how. Data is aggregated according to the DataSource across all instances that make up the Service.
How can I get started?
To get started, navigate to the Resources page and add a Service.
**Note that LM™ Service Insight is a premium, add-on feature. You may need to first reach out to your CSM to get started.