How to Debug your Groovy Script
Last updated on 29 June, 2022When you create an embedded Groovy script in your LogicMonitor account, keep in mind that it will be run inside the same JVM as your Collector.
The guidelines are as follows:
- Scripts are meant to be light-weight.
- When integrated into a Datasource, they need to execute within 1 minute.
- They also must fit within the memory resources of the Collector JVM.
- Scripts with errors can interfere with the collector’s stability.
If the script you are developing may require iterations to get it working, we recommend that you set up a sandbox environment for debugging. By installing a new collector that you use just for datasource development and script debugging, you will have the room to develop code and see how it interacts with your collector.
Using the Collector Debug Window
A groovy script within a LogicMonitor Datasource will run directly on the Collector machine, using the version of Java and Groovy provided in that environment. To run in this very same environment, we have provided a built-in command !groovy in the Collector debug window.
Step 1. Go to the Settings | Collectors
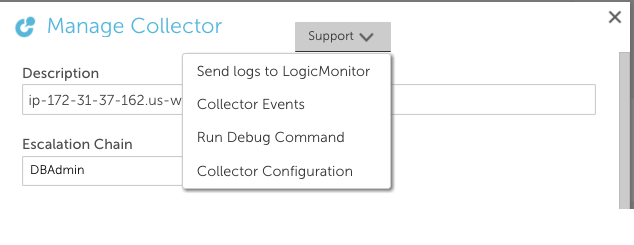
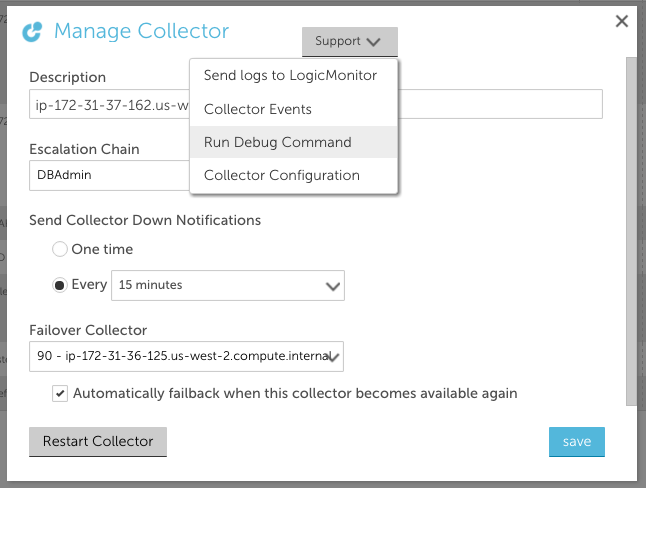
Step 2. Click the manage icon of the collector, and choose “Run debug command” from the Support drop down
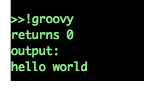
Step 3. Enter !groovy as shown below:
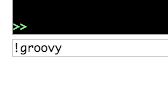
Step 4. A dialog with a big text edit box will pop up. Please edit your code there, then click “Submit”
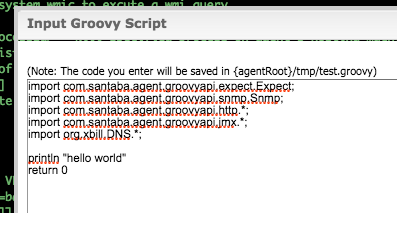
Step 5. The collector will execute the script and show the return value and output in the debug window.
You can repeat steps 3 through 6 until you get the script right. After you finish debugging the script, there are two ways to make a copy of it:
- Copy and paste the source code from the edit box
- Copy the auto-generated file /tmp/test.groovy which contains this same code
Using a Datasource
The following explains how to create a datasource to test your script using your sandbox collector.
Step 1. Create a new datasource with the desired name, group and polling interval. Then set its Collector method to ‘script’ as shown below. In our example, we named our datasource ‘GroovyTest’ and left the Collect every (polling interval) at the default setting of 3 minutes. We also entered ‘JVM’ for theGroup to help keep our datasources organized.
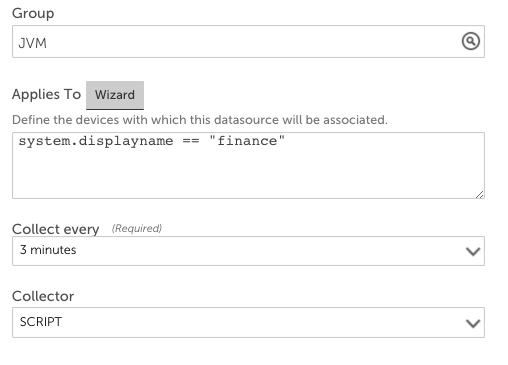
Step 2. Choose a device that is monitored by your sandbox collector. Configure your datasource to match this host/device using the Applies To function wizard. The function system.displayname == “finance”matches the device that is monitored by the sandbox collector in our example. If you don’t have anything monitored by your sandbox collector, first add a device.
Step 3. Set the Script Type to ‘Embedded groovy code’ as shown:
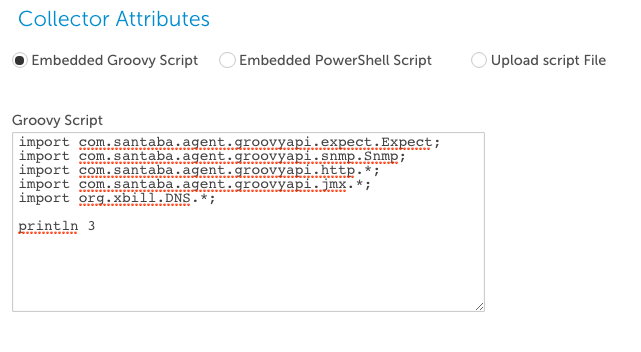
Then enter your code in the datasource Groovy Script field. In our example, we wrote a minimal script that just prints the number “3” as shown above.
Step 4. Select the ‘Add Normal datapoint’ button, and choose “execution time of script in milliseconds” for the source of the datapoint as follows:
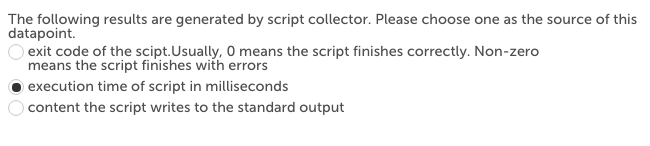
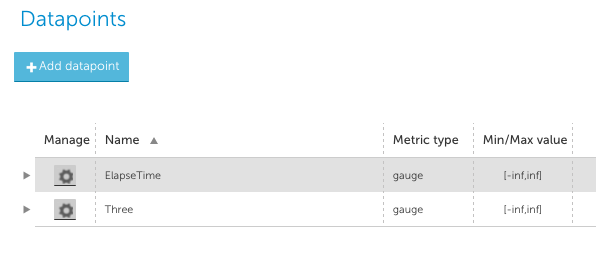
In our example, we named this datapoint ElapseTime. These datapoint source options can provide helpful feedback to see how your script is running. If your script uses exit codes, add another datapoint to monitor this return value. You can also monitor the content of standard output if your script prints values. Since our example script does print a value, we added a datapoint named Three to capture this output as well:
Step 5. Once you have created a datasource and associated it to a device (monitored by your sandbox collector), you can check to see if it is executing properly. Navigate to the devices tab and check the raw data tab for the datasource to ensure you are getting valid numbers back. You can additionally check the collector events to ensure there are no recent messages in the event log: