Monitoring your AWS hosted application
Last updated on 27 March, 2023If your company uses AWS to host applications that support your day to day operations, you should ensure that you set up your monitoring in a way that helps you maximize the uptime of these applications. Specifically, consider the following recommendations:
1. Monitor the server side infrastructure components that your application is running on
Use LogicMonitor’s standard monitoring and AWS monitoring functionalities to comprehensively monitor the different behind the scenes cloud infrastructure components that your application relies on. This includes setting up monitoring for your EC2 instances, ELBs, S3 buckets and any other AWS backend resources your application uses. Comprehensively monitoring these components will enable you to quickly pinpoint the specific components that are causing problems when issues arise.
2. Monitor the middleware used to serve your application
This can usually be accomplished one of two ways:
- Using LogicMonitor’s AWS datasources to monitor the middleware for your cloud infrastructure. As an example of this, you could monitor your RDS MySQL databases utilizing LogicMonitor’s AWS RDS datasources.
- Installing a collector within your AWS environment and using LogicMonitor’s native datasources to monitor the middleware running on your cloud infrastructure. As an example of this, you could monitor your Apache web server by installing a collector on an EC2 instance in your AWS environment, adding your EC2 instances as devices to monitoring and applying LogicMonitor’s Apache datasources.
3. Monitor the application performance from the outside
Its a good idea to monitor what a customer would experience when interacting with your application. Typically, this includes using LogicMonitor’s services checks to monitor your application from outside of your AWS environment. As an example of this, you could perform custom checks on your website that look for the presence of specific text using LogicMonitor’s services. Monitoring your application from the outside ensures that you will be able to differentiate external factors that could potentially prevent outside users from being able to access your application from issues that are occurring within the infrastructure supporting your application.
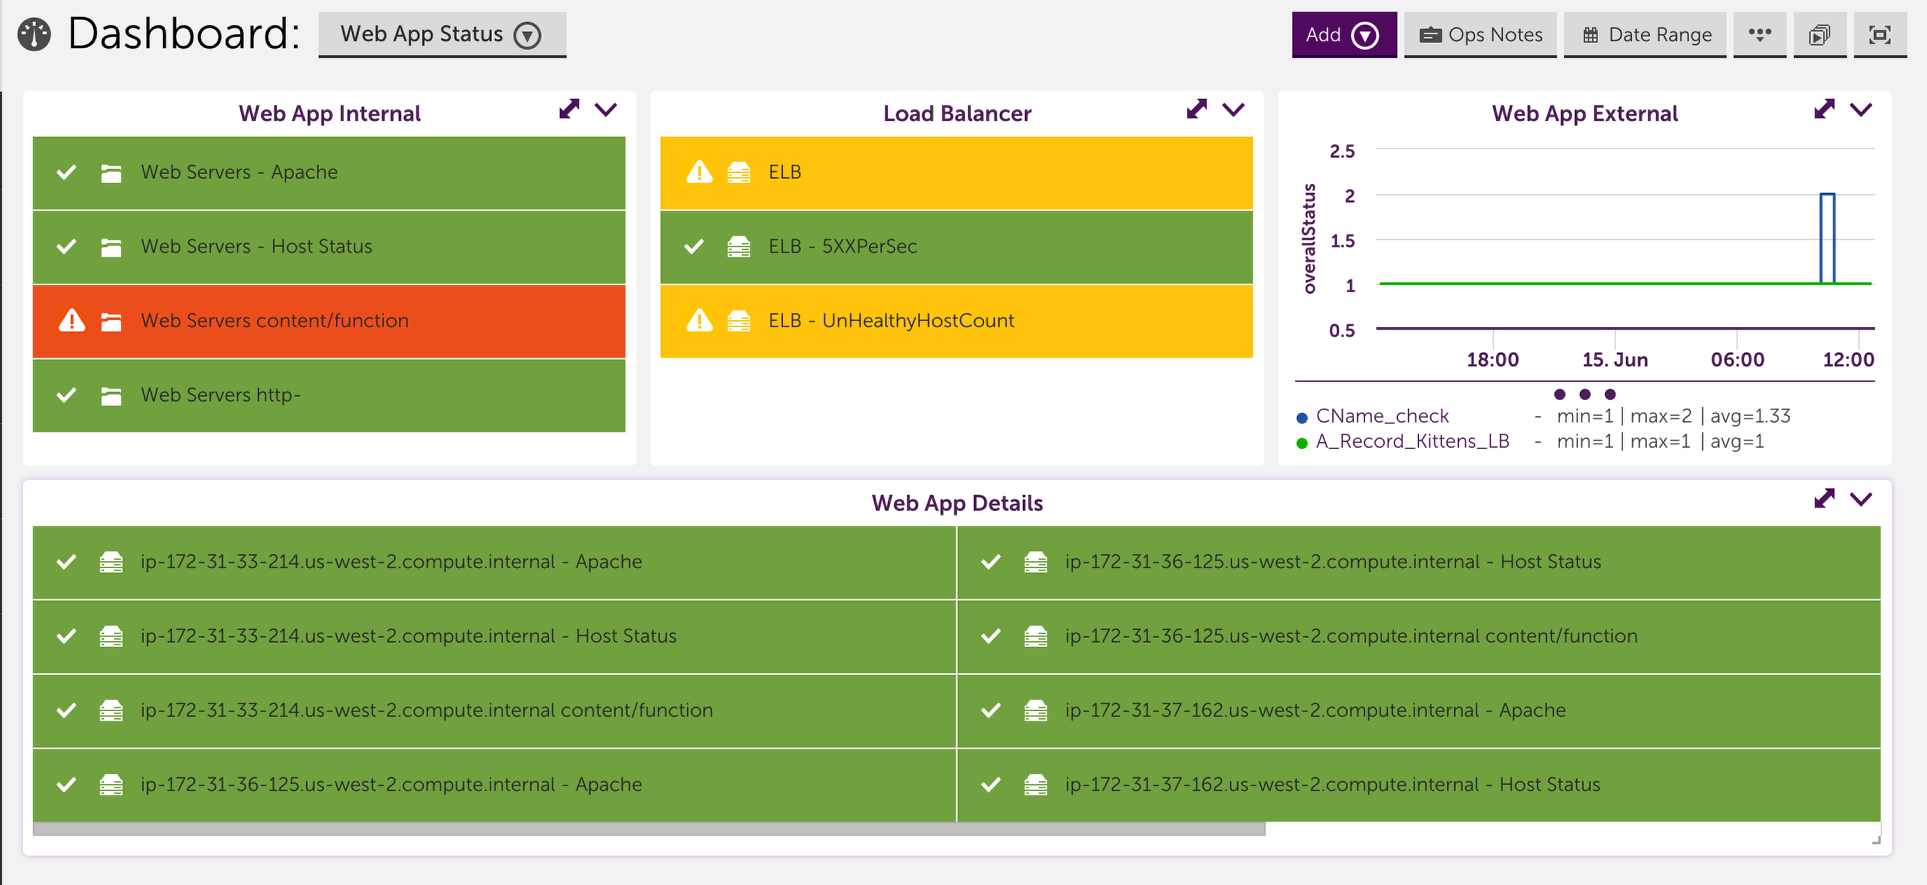
4. Set up a dashboard that displays the status of each component of your application
Consider setting up a dashboard that reflects your application. This includes setting up widgets to clearly show the status for each of the different monitored components of your application. A dashboard that is strategically set up to reflect your application enables you to look at alerts in the context of your application, allows you to compare which components are working and which aren’t and typically helps you quickly identify which component is causing the underlying issue. For example, the dashboard could include device NOC widgets that display the status of the backend infrastructure and middleware, and a service graph that displays front end performance checks: