RDS
Last updated on 27 March, 2023LogicMonitor currently has one datasource for monitoring RDS performance metrics:
- AWS_RDS – collects performance data for RDS
AWS_RDS
Source: CloudWatch
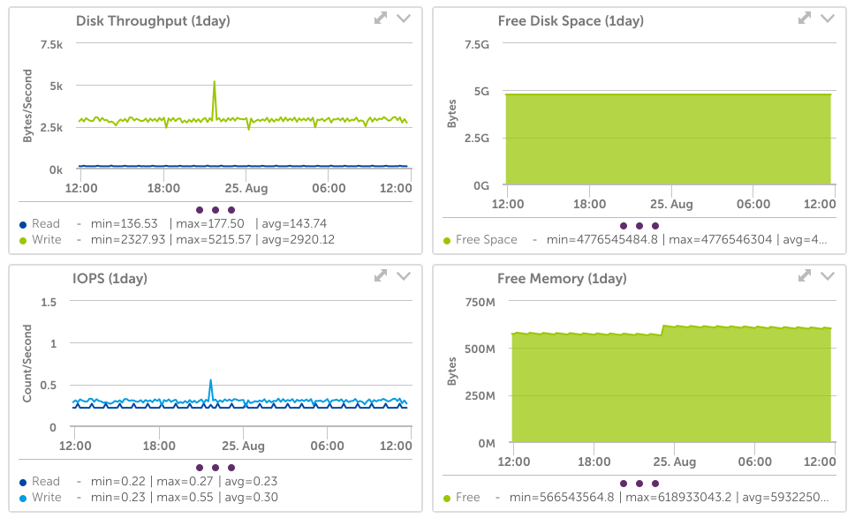
Datapoints:
- CPU utilization
- Freeable memory
- Bin log disk usage
- Free storage space
- Network received and transmitted bytes per second and throughput
- Read & Write – IOPS, latency, throughput
- Database connections
- Disk queue depth
- Replica lag
- Swap usage
Default Polling Interval: 1 minute
Additional Configuration Necessary?: No. This datasource will automatically apply to the RDS instances discovered for your AWS account and start collecting data.
Note that LogicMonitor’s native database datasources (e.g. for MySQL) provide more comprehensive metrics than what CloudWatch reports for RDS instances. Because of this, it may be beneficial to install a collector in your AWS environment (on an EC2 instance) and add your RDS endpoints as regular devices in order to monitor these metrics.

