
Adding your GCP environment into LogicMonitor
Last updated on 23 November, 2023To add your GCP account into LogicMonitor, complete the following steps:
Requirements
- Project ID and Service Account Key for a registered application in GCP Account.
Note: You may want to create a service account in the Google Cloud Platform portal before you start so that you have the Project ID and Secret Key available for setting up permissions. For more information, see Setting up a GCP account.
- Enabling the GCP APIs. See Enable the GCP APIs.
- Import GCP APIs. See Import LogicModules.
Note: Ensure to import the LogicModules before setting up a GCP account. This ensures out-of-the-box dashboards are created.
Enable the GCP APIs
Make sure that the following APIs are enabled in your GCP console before adding your GCP environment into LogicMonitor to be monitored:
- Compute Engine API
- App Engine Admin API
- Google Cloud SQL API
- Google Cloud Storage API
- Cloud Functions API
- Cloud Resource Manager API **only needed for the permission test
Importing the GCP DataSources into your LogicMonitor account
Ensure to import all of the latest GCP DataSources into your account. You can import the DataSources from Settings > DataSources > Add > From LogicMonitor Repository.
Additionally, ensure to import the latest EventSource from Settings > EventSources > Add > From LogicMonitor Repository.
Setting up a GCP Service Account
Complete the following steps to create a Service Account that LogicMonitor can use to discover and monitor your GCP resources.
1. Log into the Google Cloud Platform using an administrator account.
2. On the left panel, navigate to IAM & Admin > Service Accounts.
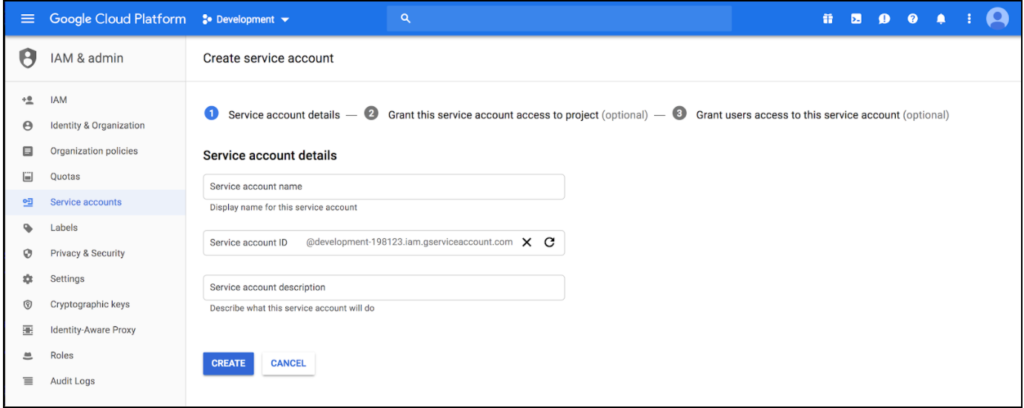
3. Click Create Service Account on the top of the page.
4. Provide a name and description, select CREATE AND CONTINUE.
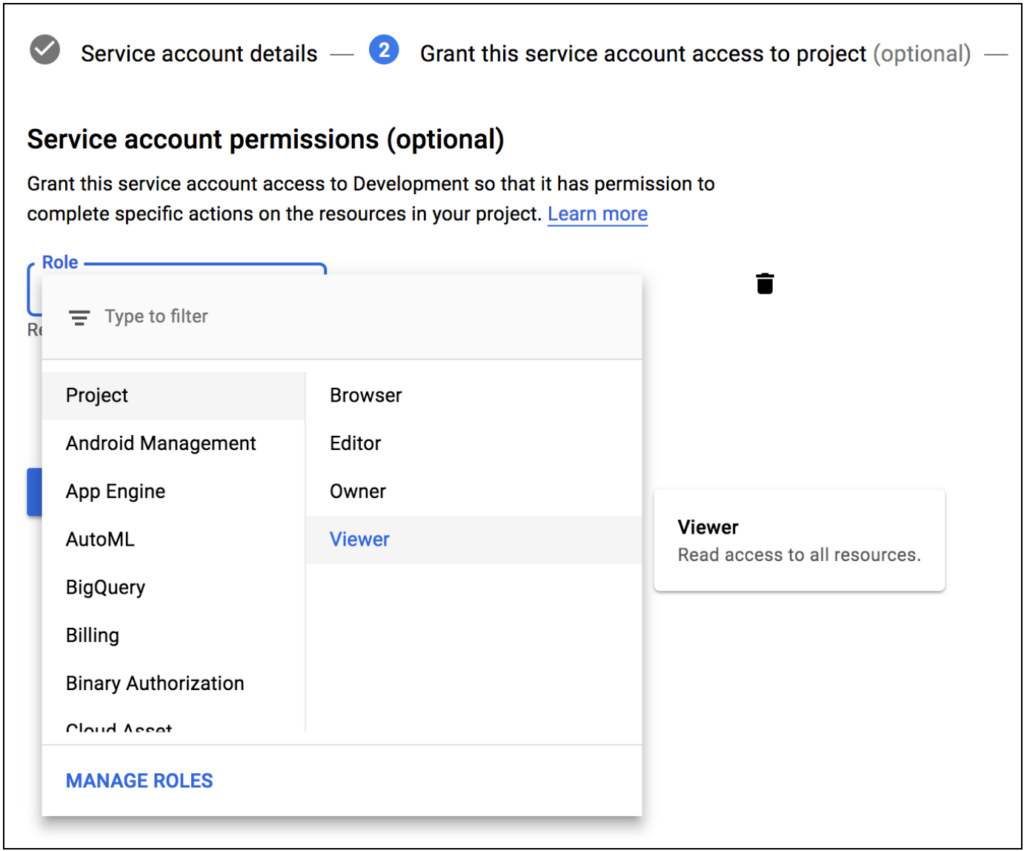
5. Specify ‘Viewer’ permissions for the service account and click Continue.
6. On the Grant the services account access to the project section, click Create Key.
7. Select key type as JSON and click CREATE.
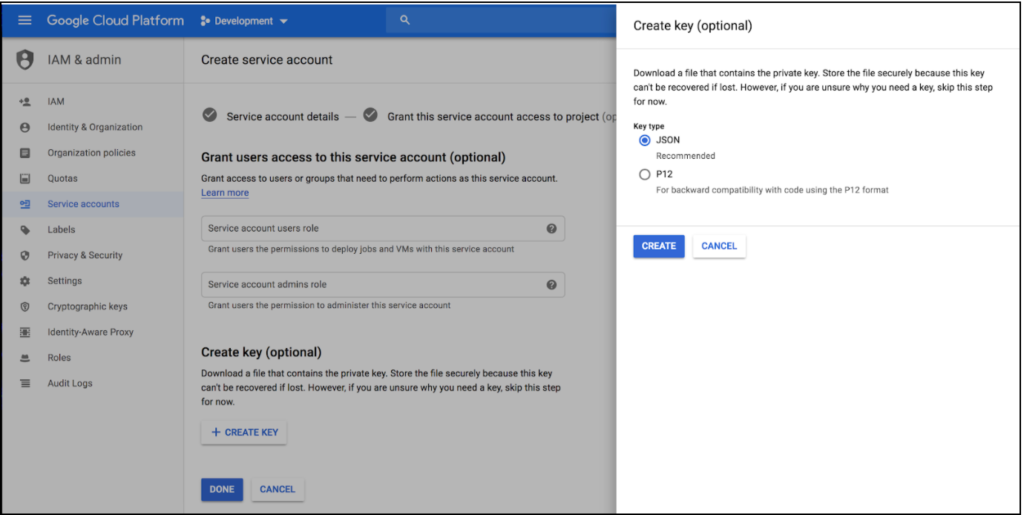
8. Downloaded the key.
Note: You will need to upload the key while setting up your GCP account in LogicMonitor along with the project ID (which you can find by selecting the drop-down arrow next to the project name in the top navigation bar of your GCP console).
Adding a GCP Account into LogicMonitor
To add the GCP account into LogicMonitor, complete the following steps.
- Add your GCP account into LogicMonitor from Resources > Add > Cloud Account.
2. Select GCP and click Add.
3. On the Name page, enter the following details:
- Name: (Required) Enter a name for the GCP account.
- Description: Provide a description for the GCP account.
- Parent Group: (Required) Assign the GCP account to a parent group. By default, it will be assigned to the root group of the portal.
- Properties: Define properties and values.
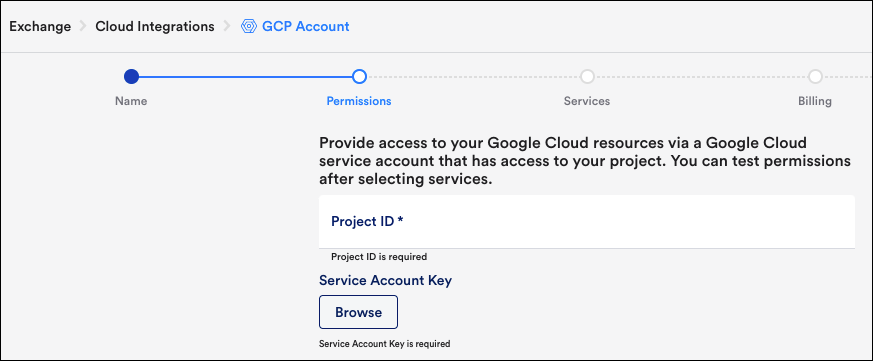
4. On the Permissions page, enter the following details:
- Project ID: (Required) The Project ID for your registered application.
- Service Account Key: (Required) The Service Account Key for your registered application.
Note: You can find this information in your Google Cloud Portal > IAM & Admin > Service Accounts.
5. Click Next: Services and on the Services page, select the services that you want to monitor.
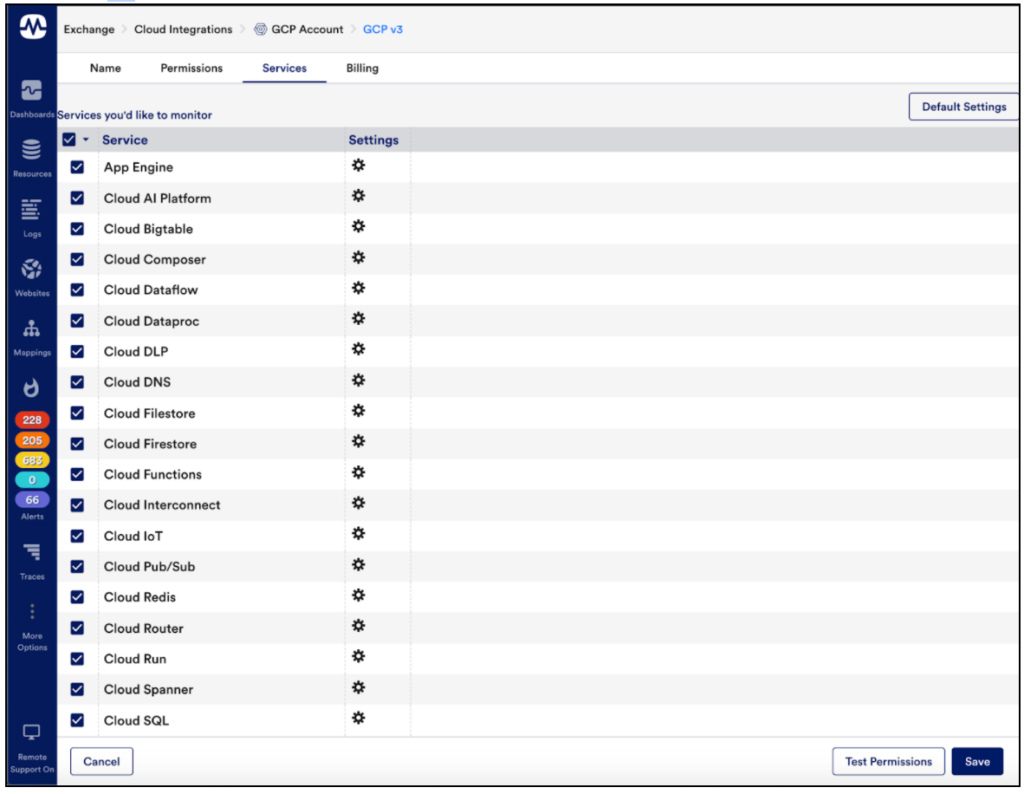
6. Click Default Settings to configure services. For more information, see Configuring GCP Services for Monitoring section.
7. Click Test Permissions.
8. Click Next: Billing.
9. On the Billing page, enter BigQuery table path (table.id). For more information, see GCP Billing Monitoring.
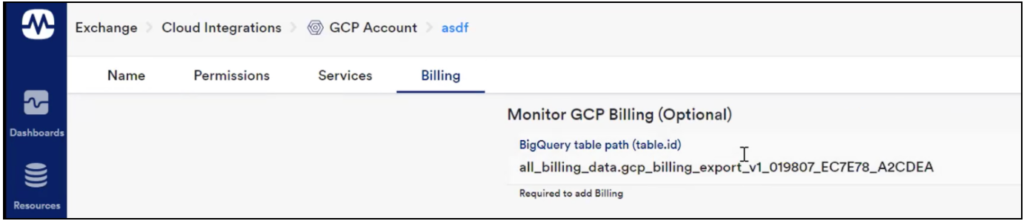
10. Click Add Billing.
11. Click View GCP Resources.
You should be able to view resources and dashboards from your GCP application.
Configuring GCP Services for Monitoring
To configure GCP services for Monitoring complete the following steps:
1. In the GCP Services section of the dialog, click Default Settings.
2. On the Default Settings page, click Global Settings.
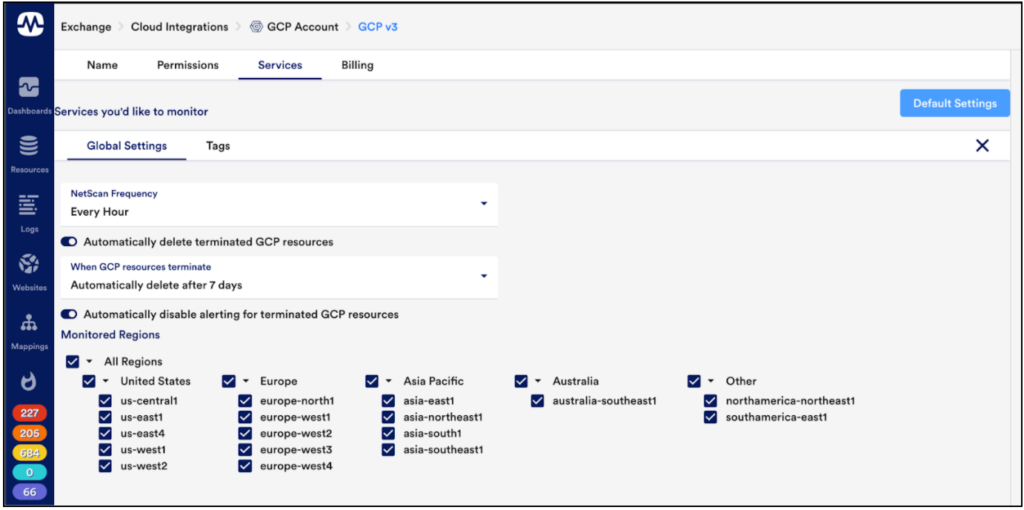
3. From the NetScan Frequency drop-down list, you can select the preferred frequency for scheduling NetScans.
4. Enable Automatically delete terminated GCP resources option, to automatically remove dead instances.
You can further select whether this should happen immediately or after a specified period during which no data is received for the instance.
5. Enable Automatically disable alerting for terminated GCP resources to disable alerting for terminated instances ensures you will not receive any alerts once instances are terminated if they are not scheduled to be automatically deleted.
Note: LogicMonitor intelligently and automatically stops GCP Monitor API data collection once instances are terminated, this option will ensure you do not receive alerts for traditional Collector DataSources like Ping
6. In the Monitored Regions section, you can select the regions that you want to monitor.
7. Click Tags, to monitor only certain GCP instances for a particular service, you can tag those instances from your GCP portal and apply a tag filter to that service in LogicMonitor.
Note: If you specify a Tag filter, only GCP resources that meet the filter criteria will be added to your LogicMonitor account. Following are the criteria:
- You can use glob expressions with the tag filter (e.g. tag value = prod*).
- Resources will be discovered if they contain one or more tags specified with an include operation but not any of the exclude tags.
- The tag filter is case-sensitive.