SQS
Last updated on 27 March, 2023LogicMonitor has two datasources for monitoring SQS performance metrics:
- AWS_SQS – collects CloudWatch performance data for SQS queues
- AWS_SQS_MessageLatency – collects actual latency to enqueue/dequeue SQS messages from collectors in multiple locations
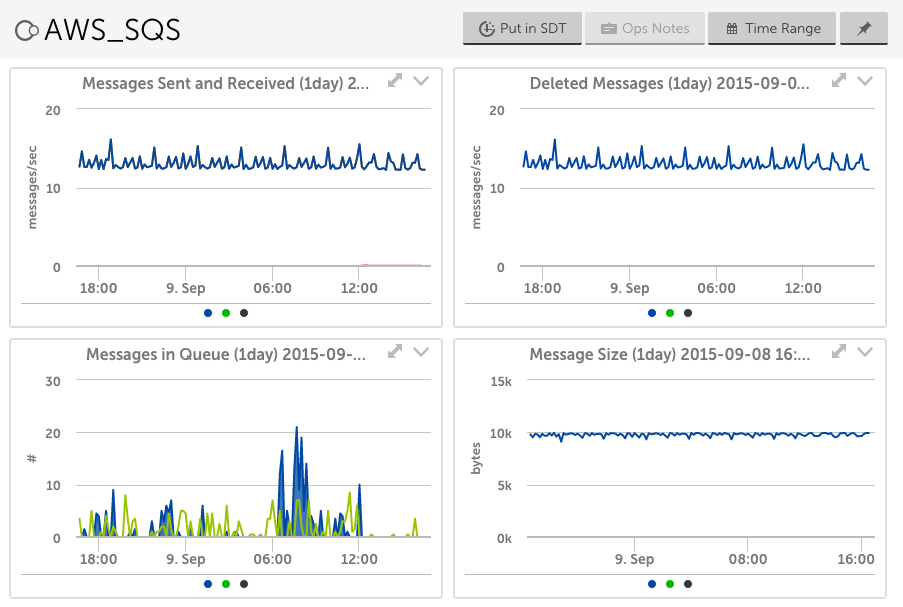
AWS_SQS
Source: CloudWatch
Datapoints:
- Messages delayed
- Messages visible & not visible
- Messages deleted
- Messages received & sent per second
- Sent message size
- Number of empty messages received
- Age of oldest message
Default Polling Interval: 5 minutes
Additional Configuration Necessary?: No. This datasource will automatically apply to the SQS resources discovered for your AWS account and start collecting data.
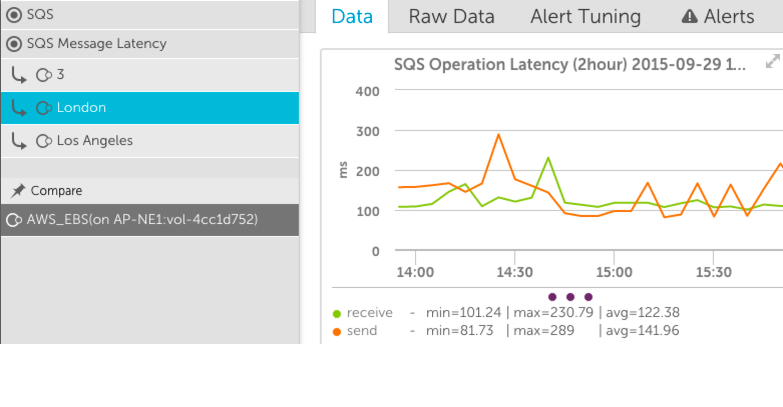
AWS_SQS_MessageLatency
This datasource utilizes the AWS SDK to perform SQS operations, and measures the transaction times. Note that this datasource does not measure the round-trip time of an individual SQS message – there is no guarantee that the message placed in a queue is the same one measured for the retrieval operation. Instead, it measures the time to perform GetMessage and ReceiveMessage operations, independently. This measurement will take into account network latency and real processing times, as measured from the collectors.
Source: AWS SDK
Datapoints:
- Receivetime
- Sendtime
- Status of queue monitoring
Default Polling Interval: 5 minutes
Additional Configuration Necessary?: Yes – see below section. This datasource inserts and removes SQS messages from a queue, and as such requires a specific SQS queue designated solely for these measurement transactions, to ensure it does not impact messages placed in other queues. To ensure accurate measurements, the configuration of this queue will be automatically set by LogicMonitor to a 1 minute message retention policy. This also ensures that the queue has been appropriately designated as a measurement queue, by ensuring that the account LogicMonitor uses to access AWS has been given complete rights to this queue.
In order to use this datasource, the following steps are required:
- create a specific SQS measurement queue in each region to be measured
- assign the AWS user that LogicMonitor is using complete rights to each SQS measurement queue
- associate the datasource with the SQS measurement queues, and designate which collector(s) should be used to generate the SQS transactions for measurement
Create SQS measurement queues
As noted above, this datasource will insert and remove messages from a queue, and so should not be associated with production SQS queues. Instead, specific SQS measurement queues should be created in each region where production SQS queues exist, in order to identify issues with accessing SQS services.
To do so, access the SQS service in the AWS console, and create a new SQS queue. We recommend naming the queue like “SQSLatencyTest_us_east_1”, to easily identify that it is for latency testing. Accept the default queue configuration – LogicMonitor will adjust the queue configuration appropriately.
You should create a latency test queue in each region that you have production SQS queues.
Assign the AWS user that LogicMonitor is using complete rights to each SQS measurement queue
Attach a policy such as the below to the AWS user that you have set up in LogicMonitor to monitor AWS:
Replace ACCOUNTID with your AWS account. This will grant the appropriate privileges to all SQS queues, in all regions, whose name starts with SQSLatencyTest. Note that the monitoring will fail unless SetQueueAttributes right is granted.
Associate the datasource, and specify where to measure from
From Settings | Datasources, search for the AWS_SQS_MessageLatency datasource.
If you created SQS measurement queues with the suggested names (containing “SQSLatencyTest”), you do not need to change the AppliesTo field.
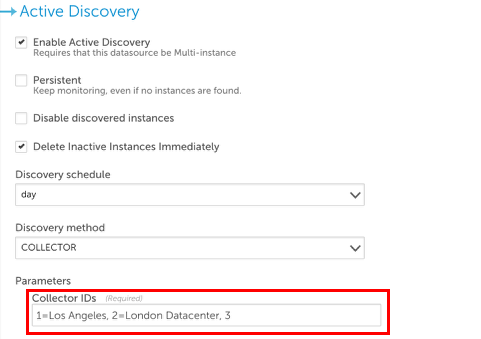
In all cases, however, you will need to edit the Collector IDs in the Active Discovery section. This specifies which collectors will run this datasource, and report on SQS latency.
You specify the collector id, and an optional identifier for that collector, for each collector that will measure the time to send and receive SQS messages.
e.g.
1=Los Angeles, 2=London Datacenter, 3
would create instances of this datasource whereby the SQS times are measured from 3 different collectors (with collector IDs 1, 2 and 3), with descriptive text shown for the first two.