
Server CPU Report
Last updated on 23 February, 2024Overview
The Server CPU report displays minimum, maximum, and average CPU values for one or more groups of devices, even if the CPU DataSources monitored for each of those devices are different (e.g. the Microsoft_Windows_CPU DataSource is used to monitor CPU for Windows servers and the NetSNMPCPUwithCores DataSource is used to monitor CPU for Linux servers). These values are presented in a tabular data format and additionally can include graphs per device. Because the flexibility of this report allows you to view graphs and numerical data together across multiple device types, you may find this report useful for quickly reviewing recent CPU performance across a group of devices.
Configuring a Server CPU Report
To configure a Server CPU report, select Reports | Add | Report | Server CPU Report. A report dialog appears that allows you to configure various report settings.
Configuring Settings Common to All Report Types
The first four settings that are found in the report dialog (Title, Description, Group, and Format), along with the final setting (Generate this report on a schedule), are universal to all report types. To learn more about these global report settings, see Creating and Managing Reports.
Configuring Server CPU Report Settings
In the Server CPU Report Settings area of the report configuration dialog, shown and discussed next, specify settings unique to the Server CPU report including time range and device group(s).
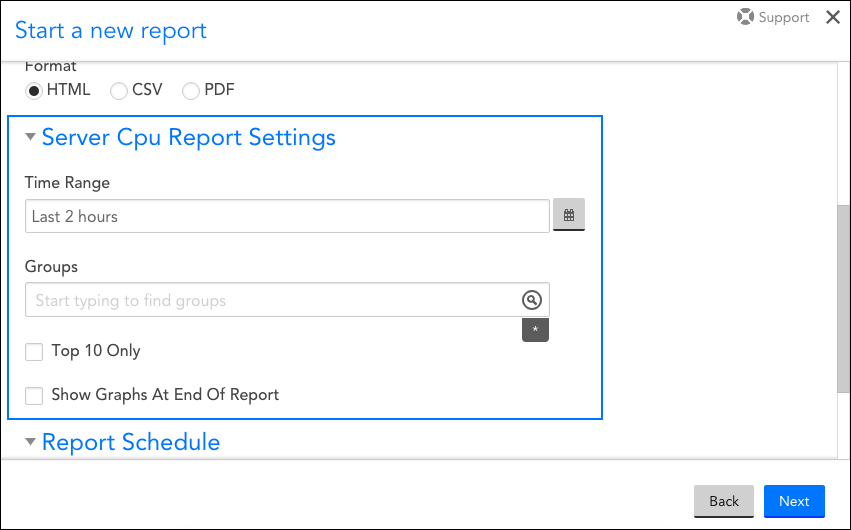
Time Range
In this field, indicate the duration of time for which you’d like to review CPU statistics.
Groups
From the Groups field, limit the devices to which this report will apply by designating one or more device groups. You can use explicit names or glob expressions in these fields.
Note: Multi-glob lookup is available here. You can select a combination of both glob and distinct values to specify your groups. For more information on LogicMonitor’s support of glob, see Using Glob throughout your account.
Top 10 Only
Select the Top 10 Only checkbox to limit the results that are displayed in the report to the top ten results.
Note: Graphs will only be displayed if this checkbox is selected.
Show Graphs At End Of Report
Select the Show Graphs At End Of Report checkbox to display all relevant graphs of CPU values at the bottom of your report (i.e. below the table of CPU values).