
What Is Website Monitoring?
Last updated on 27 July, 2023Overview
LogicMonitor allows you to periodically test website performance and availability from outside of your network, or from Collectors situated within your network. External web and ping checks monitor website accessibility and functionality as experienced by the general public, while internal web and ping checks run from an LM collector situation within the network monitor website accessibility and functionality as experienced by the business’ internal users.
LogicMonitor’s websites monitoring functionality is divided into two types of checks:
- Web Checks. Periodically make HTTP GET, HEAD or POST requests to one or more URLs (LogicMonitor can handle Basic, NTLM or form-based authentication). Web Checks can come from external locations outside of your network, or from Collectors situated within your network (known as Internal Web Checks). For instructions on adding Web Checks, see Adding a Web Check.
- Ping Checks. Periodically ping an IP address. As with Web Checks, Ping Checks can come from external locations outside of your network, or from Collectors situated within your network (known as Internal Ping Checks). For instructions on adding Ping Checks, see Adding a Ping Check.
Websites Page
Website monitoring is managed from the Websites page of your account. As shown (and discussed) next, the Websites page has three main components.
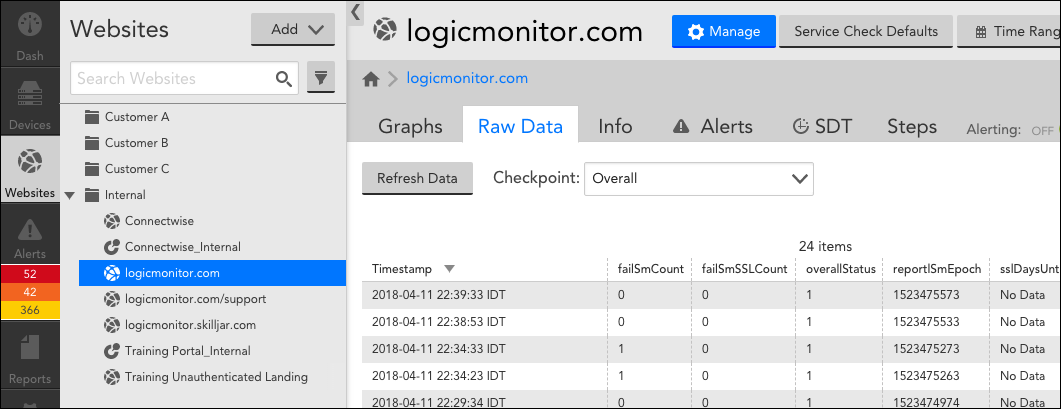
- Navigation Tree. The lefthand navigation panel allows you to navigate between and search for Web and Ping Checks and check groups
- Detail Panel. The detail panel consists of several tabs (Graphs, Raw Data, Info, Alerts, SDT, Steps) that display information relevant to the item selected in the navigation tree
- Toolbar Functions. The toolbar buttons (Manage, Website Defaults, and Time Range) enable you to edit the configurations for the selected item in the navigation tree, add ops notes, set website default settings, and change the time range for displayed data
What Data Is Monitored for Websites?
The metrics collected for a website depend on whether the website is monitored by a Web Check or Ping Check. Collected data is available for viewing from a website’s Graphs and Raw Data tabs. As highlighted in the following screenshot, both of these tabs track website data on a per-checkpoint basis ( ![]() ) and on an overall checkpoint basis (
) and on an overall checkpoint basis ( ![]() ).
).
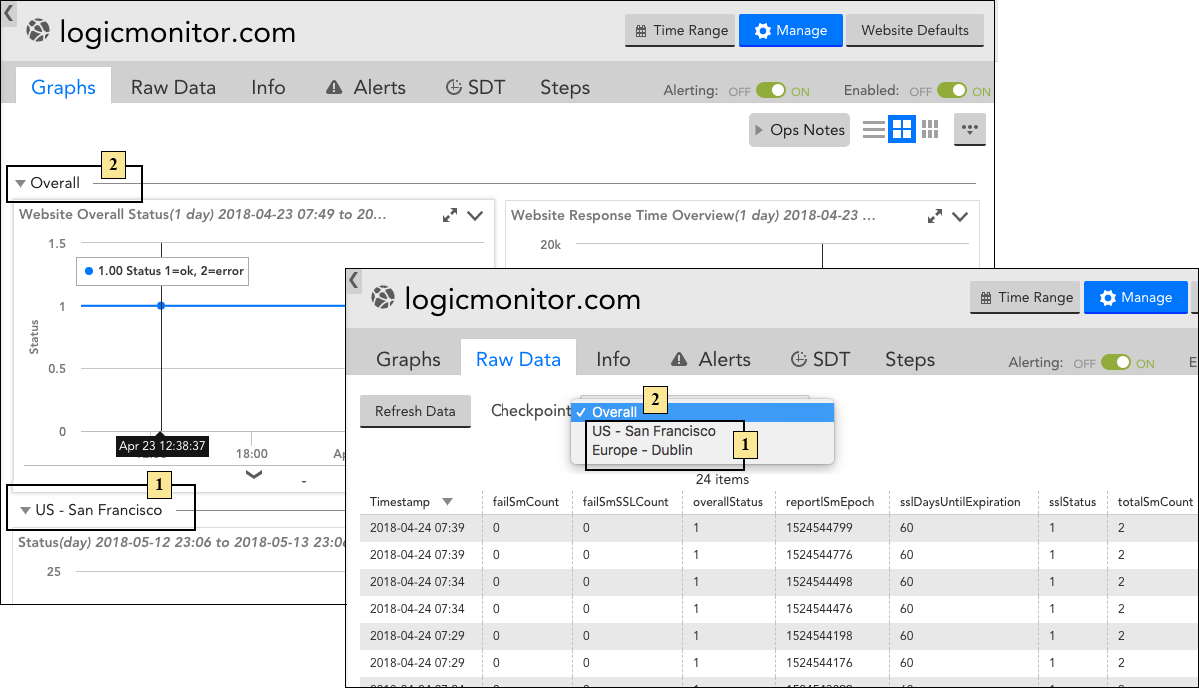
Note: In addition to viewing website metrics on the Graphs and Raw Data tabs for a website, you can also view these metrics from your dashboards. See Widget Overview for more information on adding website metrics to your dashboards.
Data Monitored for Web Checks
For each checkpoint configured in your Web Check (whether an external LogicMonitor checkpoint or internal Collector), the following data is monitored:
- Response time. The time (in milliseconds) it takes to run the entire Web Check is available per checkpoint location, both visually in graph form on the Graphs tab (i.e. the “Response Time” graph) and as columnar data on the Raw Data tab.
- Status. The status of the Web Check (e.g. okay, timeout, etc.) is available per checkpoint location, both visually in graph form on the Graphs tab (i.e. the “Status” graph) and as columnar data on the Raw Data tab. For a description of the various status codes LogicMonitor returns for Web Checks, see Understanding Website Status Codes.
- Read time. The total time (in milliseconds) spent reading all data sent back by the server, from first to last byte. This data is available per checkpoint location, both visually in graph form on the Graphs tab (i.e. “Initial Connection Performance” graph) and as columnar data on the Raw Data tab. Only the read time for the first step of a Web Check is collected.
- Wait time. The server-side process delay (in milliseconds). This data is available per checkpoint location, both visually in graph form on the Graphs tab (i.e. the “Initial Connection Performance” graph) and as columnar data on the Raw Data tab. Only the read time for the first step of a Web Check is collected.
- SSL handshake time. The time (in milliseconds) spent negotiating the SSL handshake, including certificate exchange and validation. This data is available per checkpoint location, both visually in graph form on the Graphs tab (i.e. the “Initial Connection Performance” graph) and as columnar data on the Raw Data tab. Only the read time for the first step of a Web Check is collected.
- SSL status. The status of the website’s SSL environment (e.g. okay, expired certificate, etc.) is available per checkpoint location as columnar data on the Raw Data tab. For a description of the various status codes LogicMonitor returns for SSL status, see Understanding Website Status Codes.
- Connect time. The time (in milliseconds) required to establish the socket connection, including the SYN/ACK negotiation. This data is available per checkpoint location, both visually in graph form on the Graphs tab (i.e. the “Initial Connection Performance” graph) and as columnar data on the Raw Data tab. Only the read time for the first step of a Web Check is collected.
- DNS resolve time. The time (in milliseconds) required to resolve the DNS, including the time required to contact the DNS server if necessary. This data is available per checkpoint location, both visually in graph form on the Graphs tab (i.e. the “Initial Connection Performance” graph) and as columnar data on the Raw Data tab. Only the read time for the first step of a Web Check is collected.
In addition to viewing data on a per-checkpoint basis, there are a few metrics offered that provide a view into the health of the Web Check overall (i.e. aggregated across all checkpoint locations):
- Overall status. If no checkpoint locations return an error, LogicMonitor returns an overall status code of “1.” If an error at one or more checkpoints is detected, LogicMonitor returns an overall status code of “2.” Overall status is available both visually in graph form on the Graphs tab (i.e. the “Website Overall Status” graph) and as columnar data on the Raw Data tab. To get more specific information about an overall status error, you’ll need to review the Web Check status codes for the individual test locations.
- Overall SSL status. If no checkpoint locations return an SSL error, LogicMonitor returns an overall status code of “1.” If an error at more than one checkpoint is detected, LogicMonitor returns an overall status code of “2.” Overall SSL status is available as columnar data on the Raw Data tab. To get more specific information about an overall SSL status error, you’ll need to review the status codes for the individual test locations.
- Total site monitor count. The number of checkpoints that participated in the check. This count is available as columnar data on the Raw Data tab (i.e “totalSmCount”).
- Failed site monitor count. The number of checkpoints that failed in the check. This count is available as columnar date on the Raw Data tab (i.e. “failSmCount”).
- Reporting timestamp. The timestamp (in seconds) when the site monitor reported the data. This count is available as columnar date on the Raw Data tab (i.e. “reportlSmEpoch”).
Data Monitored for Ping Checks
For each checkpoint configured in your Ping Check (whether an external LogicMonitor checkpoint or internal Collector), the following data is monitored:
- Trace route. Check the Trace Route option to see the list of host names or IP addresses test packets are routed through from the originating test checkpoint to the destination host name or IP address (live data capture only for troubleshooting purposes; trace route information is not stored for historical purposes).
- Status. The status of the Ping Check (e.g. okay, DNS failure, etc.) is available per checkpoint location, both visually in graph form on the Graphs tab (i.e. the “Status” graph) and as columnar data on the Raw Data tab. For a description of the various status codes LogicMonitor returns for Ping Checks, see Understanding Website Status Codes.
- Maximum, minimum, and average round trip times. The maximum, minimum, and average round trip times (RTT) for packets in the Ping Check is available per checkpoint location, both visually in graph form on the Graphs tab (i.e. the “Response Time” graph) and as columnar data on the Raw Data tab.
- Number of sent and received packets. The number of packets sent and received in the Ping Check is available per checkpoint location, both visually in graph form on the Graphs tab (i.e. the “Ping Statistics” graph) and as columnar data on the Raw Data tab.
In addition to viewing data on a per-checkpoint basis, there are a few metrics offered that provide a view into the health of the Ping Check overall (i.e. aggregated across all checkpoint locations):
- Overall status. If no checkpoint locations return an error, LogicMonitor returns an overall status code of “1.” If an error at more than one checkpoint is detected, LogicMonitor returns an overall status code of “2.” Overall status is available both visually in graph form on the Graphs tab (i.e. the “Website Overall Status” graph) and as columnar data on the Raw Data tab. To get more specific information about an overall status error, you’ll need to review the Ping Check status codes for the individual test locations.
- Total site monitor count. The number of checkpoints that participated in the check. This count is available as columnar data on the Raw Data tab (i.e “totalSmCount”).
- Failed site monitor count. The number of checkpoints that failed in the check. This count is available as columnar date on the Raw Data tab (i.e. “failSmCount”).
- Reporting timestamp. The timestamp (in seconds) when the site monitor reported the data. This count is available as columnar date on the Raw Data tab (i.e. “reportlSmEpoch”).
LogicMonitor’s External Testing Locations
LogicMonitor has several testing locations you can use for Web Checks and Ping Checks. These checkpoints are part of our SiteMonitor service and are intended to provide you with details about access to your website externally.
You will get better test information if you are not explicitly watching for traffic from a given IP address. For this reason, we do not recommend you directly add the IP addresses of these locations to your allow list, and they are likely to change more frequently than our other server addresses. If you find that you need to restrict pages to SiteMonitor requests, the best options are:
- Look for the user-agent “LogicMonitor SiteMonitor/1.0”. This will be used by all SiteMonitor requests.
- Set your own custom header while formulating the Web or Ping check and filter on that.
However, if you need to explicitly allow access to the list of IP addresses SiteMonitor may check from, you will find each location, along with its allocated IP address/address block, listed next.
Note: Locations are not necessarily grouped together in this listing so please review entire list for all IPs corresponding to a particular checkpoint.
- Asia - Singapore - 18.139.118.192/26
- Australia - Sydney - 3.106.118.64/26
- EU - Dublin - 52.215.168.128/26
- US - Oregon - 34.223.95.64/26
- US - Washington DC - 52.202.255.64/26
Access the list of public IP addresses here: TXT | JSON | XML