Zendesk Integration
Last updated on 08 December, 2022While LogicMonitor has a robust alert delivery, escalation, and reporting system, you may be using other tools in parallel to access and store IT information.
You can use LogicMonitor’s custom HTTP delivery integration settings to enable LogicMonitor to create, update, and close tickets in Zendesk in response to LogicMonitor alerts.
In this support article, we’ve divided the process of creating a Zendesk/LogicMonitor integration into three major steps:
- Familiarize yourself with background resources
- Ready Zendesk for integration
- Create the Zendesk custom HTTP delivery integration in LogicMonitor
Familiarize Yourself with Background Resources
Review the following resources before configuring your Zendesk integration:
- LogicMonitor support article: Custom HTTP Delivery. This support article provides an overview of the various configurations and settings found in LogicMonitor’s custom HTTP delivery integrations.
- LogicMonitor support article: Tokens Available in LogicModule Alert Messages. This support article provides an overview of the available tokens that can be passed through to Zendesk. Note: The examples in this support article additionally use a ##zendesk.authorid## token that was created as a custom property on the device. Custom device properties can be very useful when using the same integration to create tickets as multiple organizations or users.
- Zendesk developer documentation: API Introduction
Ready Zendesk for Integration
To ready Zendesk for integration, perform the following steps:
- Create a Zendesk user to be used for authentication.
- Configure your Zendesk API key for authentication.
Create the Zendesk Custom HTTP Delivery Integration in LogicMonitor
To create a Zendesk/LogicMonitor custom HTTP delivery integration that can create, update, and close tickets in Zendesk in response to LogicMonitor alerts, perform the following steps:
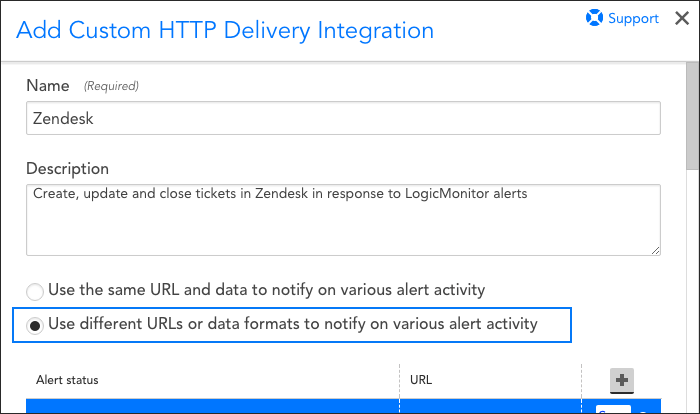
- Select Settings > Integrations > Add > Custom HTTP Delivery.
- Enter a name and description for the Zendesk integration.
- Select Use different URLs or data formats to notify on various alert activity.
This allows LogicMonitor to take different actions in Zendesk, depending on whether the alert is being created, acknowledged, cleared, or escalated.
- Specify settings for creating a new ticket (as triggered by a new alert):
Note: For each request, you can select which alert statuses trigger the HTTP request. Requests are sent for new alerts (status: Active), and can also be sent for alert acknowledgements (status: Acknowledged), clears (status: Cleared) and escalations/de-escalations/adding note (status: Escalated). If the escalated status is selected and a note is added to the alert, an update request is sent whether the alert is active/cleared. If the escalated status is not selected and a note is added to the alert, a request is not sent.- Select HTTP Post as the HTTP method and enter the URL to which the HTTP request should be made. Format the URL to mimic this path structure: “[acme].zendesk.com/api/v2/tickets.json”. Be sure to preface the URL with “https://” in the preceding drop-down menu.
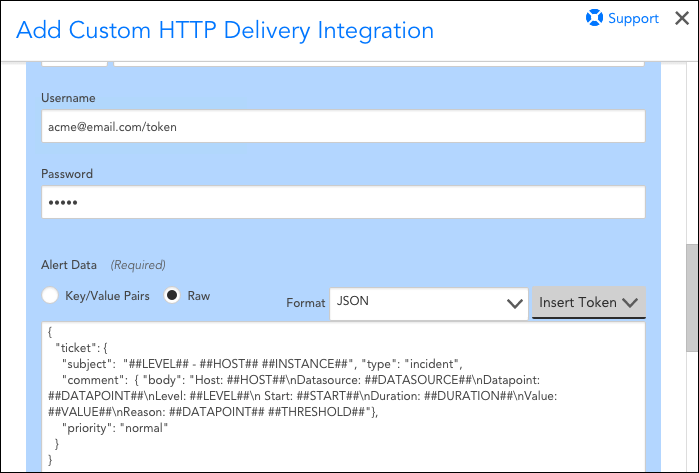
- Provide username and password values.
Note: When authenticating with the Zendesk API, you only need to enter the API key in the password field and your username with “/token” appended at the end, as shown in the next screenshot. - The settings under the “Alert Data” section should specify raw JSON, and the payload should look something like the following as a starting point:
{ "ticket": { "subject": "##LEVEL## - ##HOST## ##INSTANCE##", "type": "incident", "comment": { "body": "Host: ##HOST##\nDatasource: ##DATASOURCE##\nDatapoint: ##DATAPOINT##\nLevel: ##LEVEL##\n Start: ##START##\nDuration: ##DURATION##\nValue: ##VALUE##\nReason: ##DATAPOINT## ##THRESHOLD##"}, "priority": "normal" } }
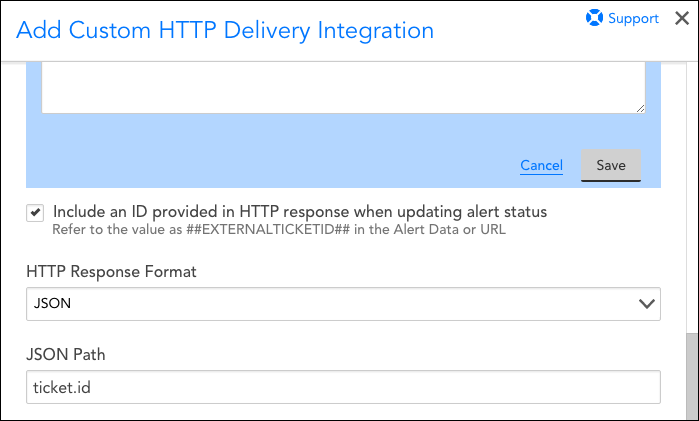
- If you want LogicMonitor to update the status of your Zendesk tickets when the alert changes state or clears, check the “Include an ID provided in HTTP response when updating alert status” box. Enter “JSON” as the HTTP response format and enter “ticket.id” as the JSON path, as shown next. This captures Zendesk’s identifier for the ticket that is created by the above POST so that LogicMonitor can refer to it in future actions on that ticket using the ##EXTERNALTICKETID## token.
- Click the Save button located within the blue box to save the settings for posting a new alert.
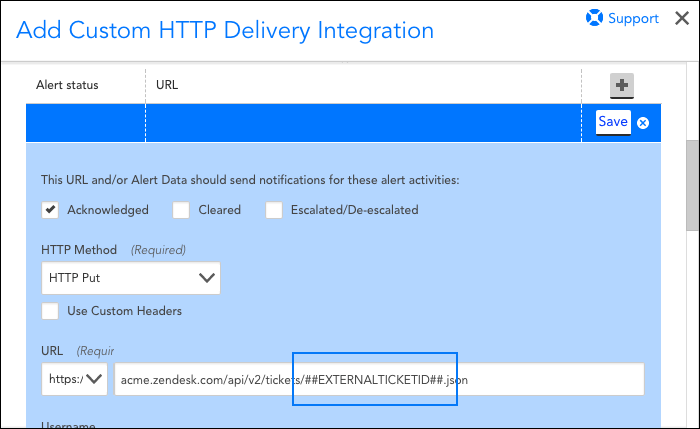
- Click the + icon to specify settings for acknowledged alerts, if applicable to your environment. Several settings remain the same as entered for new alerts, but note the following changes:
- Select Acknowledged.
- Select “HTTP Put” as the HTTP method and enter the URL to which the HTTP request should be made. Notice that the URL in the following screenshot references a slightly different URL path than the one used to create a new ticket and includes the ##EXTERNALTICKETID## token in order to pass in the ticket we want to acknowledge.
- The payload should look something like the following as a starting point:
{ "ticket": { "status": "open", "comment": { "body": "##MESSAGE##", "author_id": "##zendesk.authorid##" } } }
- Save the settings for acknowledged alerts and then click the + icon to specify settings for escalated alerts, if applicable to your environment. Several settings remain the same as entered for acknowledged alerts, but note the following changes:
- Check the “Escalated/De-escalated” box.
- The payload should look something like the following as a starting point:
{ "ticket": { "subject": "##LEVEL## - ##HOST## ##INSTANCE##", "type": "incident", "comment": { "body": "Alert Escalated/De-escalated:\nHost: ##HOST##\nDatasource: ##DATASOURCE##\nDatapoint: ##DATAPOINT##\nLevel: ##LEVEL##\n Start: ##START##\nDuration: ##DURATION##\nValue: ##VALUE##\nReason: ##DATAPOINT## ##THRESHOLD##"}, "priority": "normal" } }
- Save the settings for escalated alerts and then click lick the + icon to specify settings for cleared alerts. Several settings remain the same as entered for acknowledged and escalated alerts, but note the following changes:
- Check the “Cleared” box.
- The payload should look something like the following as a starting point:
{ "ticket": { "subject": "##LEVEL## - ##HOST## ##INSTANCE##", "type": "incident", "comment": { "body": "Alert Cleared:\nHost: ##HOST##\nDatasource: ##DATASOURCE##\nDatapoint: ##DATAPOINT##\nLevel: ##LEVEL##\n Start: ##START##\nDuration: ##DURATION##\nValue: ##VALUE##\nReason: ##DATAPOINT## ##THRESHOLD##"}, "status": "solved","priority": "normal" } }
- Save the settings for cleared alerts and then click the Save button at the very bottom of the screen to save your new Zendesk custom HTTP delivery integration.
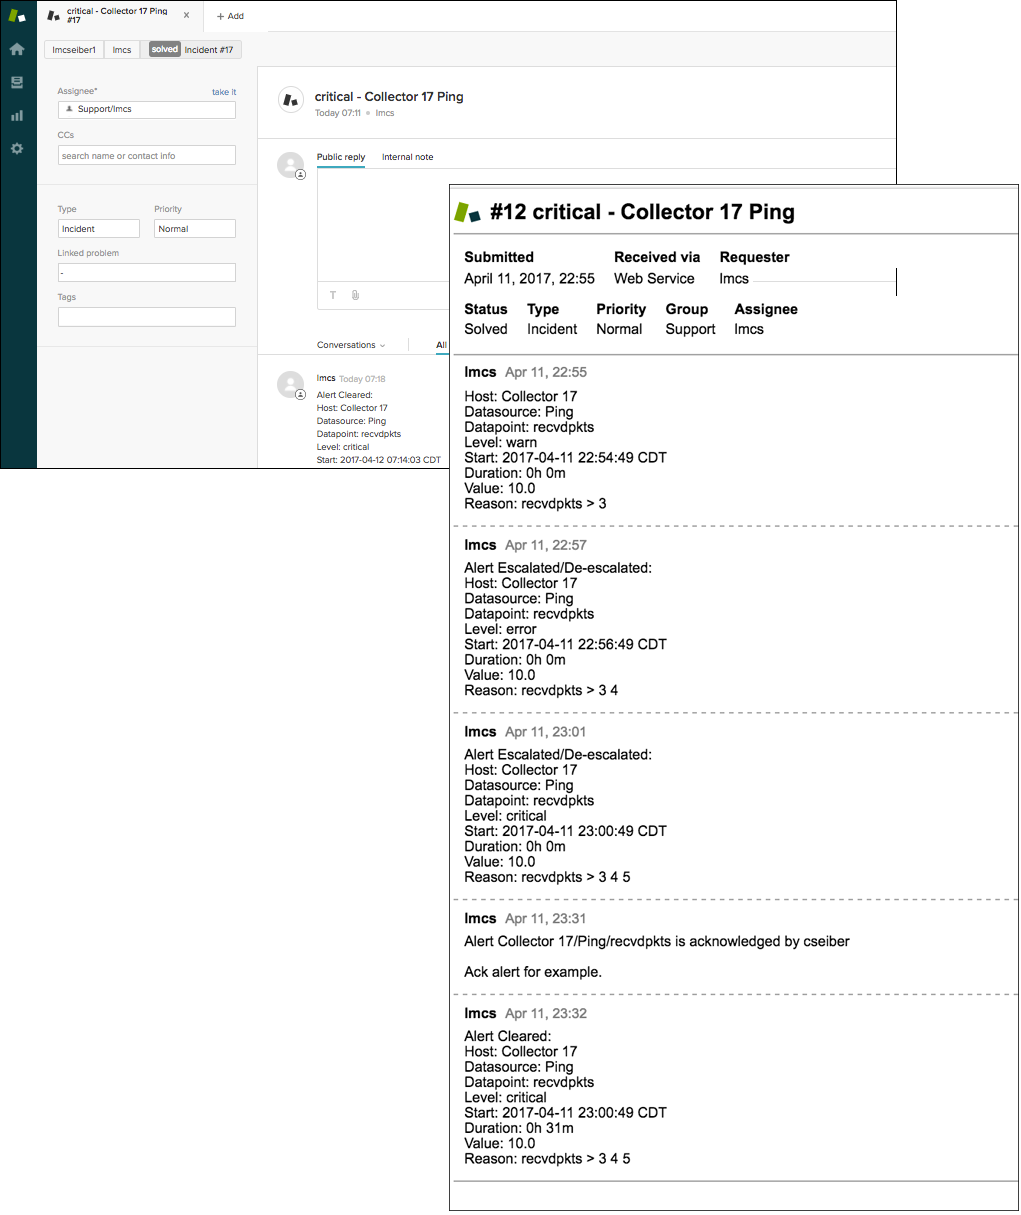
- Add your newly created delivery method to an escalation chain that is called by an alert rule. Once you do, Zendesk issues will be automatically created, updated, and cleared by LogicMonitor alerts, as shown next.
Note: Alert rules and escalation chains are used to deliver alert data to your Zendesk integration. When configuring these, there are a few guidelines to follow to ensure tickets are created and updated as expected within Zendesk. For more information, see Alert Rules and Escalation Chains.