
External Scripting
Last updated on 13 March, 2024Overview
In addition to embedded scripting with Groovy and PowerShell, LogicMonitor also provides support for external scripts using whatever language you prefer. Although we typically recommend Groovy for most tasks that require scripting, you may have expertise in a particular language that you’d prefer to use. Alternately, you can use external scripting to execute any arbitrary program on the Collector directly and use its output to collect data.
The main challenge with DataSources that employ external scripting for data collection isn’t so much in the scripting itself as it is in the management of the Collector infrastructure. For example, if you write a scripted DataSource in Ruby v2.1 that requires particular RubyGems, you may not be able to run that same script on a Collector that has Ruby v1.9, or doesn’t have those Gems installed. So, while not a huge challenge, care should be taken with version and extension dependencies when using external scripts.
External Script Configuration
To configure external scripting for your DataSource’s collection method, there are three primary steps you must take from the DataSource definition (Settings|DataSource):
- Upload the script
- Specify the script name
- Provide the script parameters
Upload the Script
Once you’ve written your script, use the Upload Script button found in the DataSource definition to upload it to the LogicMonitor platform. This ensures that, once applied, your script will automatically deploy to any Collectors assigned to devices that require this DataSource. If you have multiple scripts (e.g. one Linux and one Windows), you can upload both, one after the other.
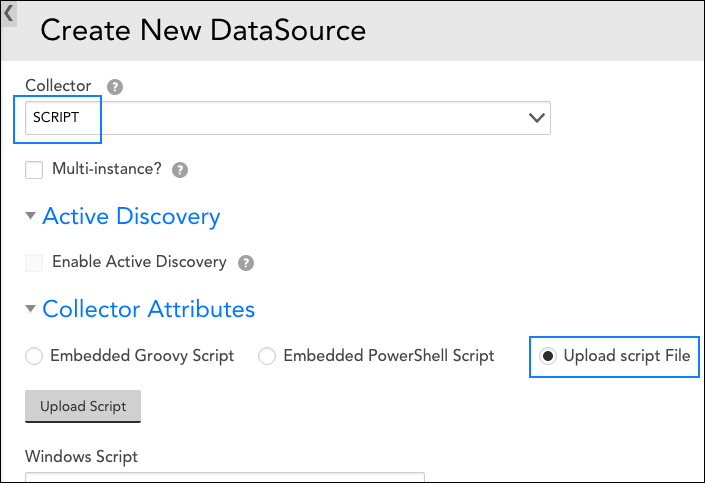
As shown next, you must have “SCRIPT” selected from the Collector field’s dropdown as well as the Upload script File option selected in order for the Upload Script button to appear.
External scripts are installed onto the ‘agent/local/bin/’ subdirectory within the LogicMonitor Collector. Although it is possible to manually copy your script directly into this location (e.g. using orchestration tools such as Puppet or Chef), we strongly recommend auto-deploying via the DataSource definition for the following reasons:
- Ensured consistency between the script and the DataSource definition. LogicMonitor maintains synchronization between the script you’ve uploaded and what is installed to the Collector. If an external script get inadvertently modified on the Collector, it will be forcibly resynchronized with the version maintained upstream.
- Easy script updating. If an external script needs updating, you can upload the new version from the DataSource definition and it will automatically get distributed to your Collectors as needed.
- Automatic distribution to all relevant Collectors. LogicMonitor distributes scripts to all necessary Collectors. An example of when this is especially helpful is in a Collector down situation. The device monitored by the downed Collector will fail over to the backup Collector, but if this Collector was overlooked and there is no script file on that Collector, data collection will fail.
Specify the Script Name
In the Windows Script and/or Linux/Unix Script fields, provide the name of the script you’ve uploaded. Note that Linux scripts and Windows scripts are handled separately because, in many cases, an external script may not behave in the same way across both platforms. If the script you’ve written is targeted only for a particular OS, feel free to leave either section blank. If you are relying on a script that resides outside of the default subdirectory, the full path must be defined.
Note: Any scripts uploaded via the Upload Script button will be delivered to a targeted Collector only if the script name exactly matches the name of the script that was uploaded.
Provide the Script Parameters
The Script Parameters field is used to pass any arguments to your scripts. When passing multiple parameters, provide each argument individually and separate by whitespace. Do not use double quotes to enclose your argument string.
Typically, you would use this field to provide any resource properties to your script. For example, you could pass ##system.hostname## as a parameter, and your script will capture this as an argument to indicate which resource this script should act upon.
Note: On Windows, it can be difficult to determine the script interpreter that is solely based on a file’s extension. It’s best to provide the script interpreter in the Windows Script field and the full path, along with any arguments, in the Script Parameters field. For example, with a Python script, you’d provide c:\python27\python.exe as the script name and c:\program files (x86)\logicmonitor\agent\lib\monitor_script.py ##system.hostname## as the script parameters. In this case, you do need double quotes to encompass the script filename and associated arguments.
Example: Using an External Script DataSource to Monitor Log File Size
As an example, here’s an external script that will monitor the size of all log files generated by a Tomcat application server. Tomcat writes all logging messages into a directory ${TOMCATROOT}/logs/catalina.out, where TOMCATROOT is the directory in which Tomcat is installed. In this case we’ll track the size of catalina.out and trigger an alert when it’s > 1GB in size.
- First we need to write the script. The following is a sample perl script we’ve named tomcat_log_size.pl. It’s written to take a single argument that contains the Tomcat root directory.
#!/usr/bin/perl use warnings; use strict; # ingest the single argument array a single variable my ($tomcatRoot) = @ARGV; # run the "stat" function on the filename and collect the output as an array my @result = stat( "$tomcatRoot/logs/catalina.out" ); # exit with a non-zero code if we didn't get a valid result from stat exit 1 if ( !@result ); # the 7th element in the array is size in bytes; print this out print $r[7]; # exit to indicate we got a valid result exit 0; - Once written, we’ll test that it works by running it on the command line:
$ ./tomcat_log_size.pl /usr/local/tomcat 3710925 - Next we’ll create a device property named “tomcat.root” on each device where we want to monitor the Tomcat log file. The value stored in the tomcat.root property will be the directory in which Tomcat is installed on that system.
Note: Our script can only monitor Tomcat installations running on the same host as the Collector since the script doesn’t accommodate any remote connectivity. But this would be a fairly straightforward change.
- Next, create a script DataSource, select the Upload script File option to indicate script type, and then use the Upload Script button to upload the tomcat_log_size.pl script.
- In the Linux/Unix Script field, enter “tomcat_log_size.pl” as the file name and specify ##tomcat.root## in the Parameters field underneath.
Note: If we had created a similar script to run on Windows, we would repeat the last two steps to upload and configure a Windows-specific version of this script to this DataSource definition.
- In our datapoint definition, we need to specify what kind of data we want to collect from the script. Because our script was written to print the file size to standard output, we’ll tell our datapoint to use standard output as it source.
- Next, we need to select a post-processor method to interpret the output. Because our script is returning only a single value, we can can select the no interpretation; use directly option. If the script output has multiple values, we could extract them as key-value pairs or with a regular expression.
- Set a static threshold for the datapoint so that we’ll know when it exceeds 1GB.
- Now that we have a datapoint, we can create a graph to display how this data changes over time.