Synthetic Website Monitoring
Monitor core website vitals from across the globe and gain visibility into uptime and availability. Improve end-user experience with on-the-spot service checks and synthetic transactions that optimize the health and performance of your websites.
Synthetic website monitoring made easy
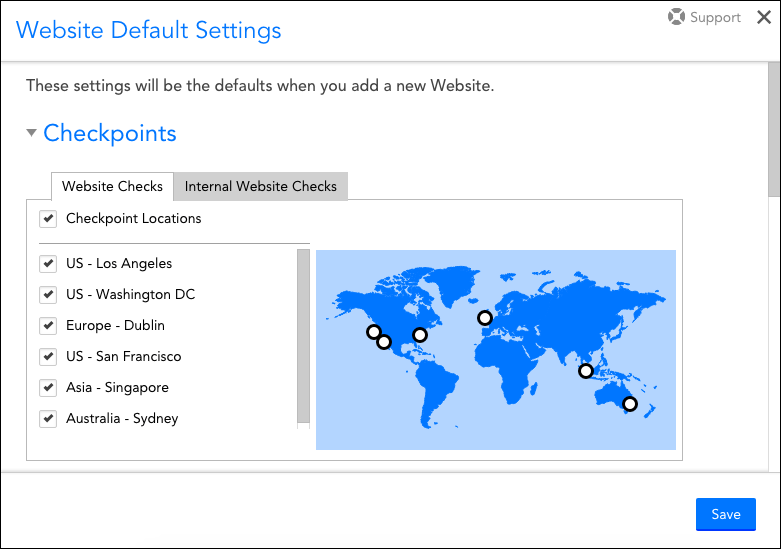
Have confidence that your websites are up and accessible from one or multiple external test locations, or monitor from within your network and ensure your employees can access critical internal sites – all within the same platform as the rest of your cloud and infrastructure monitoring.
Web checks
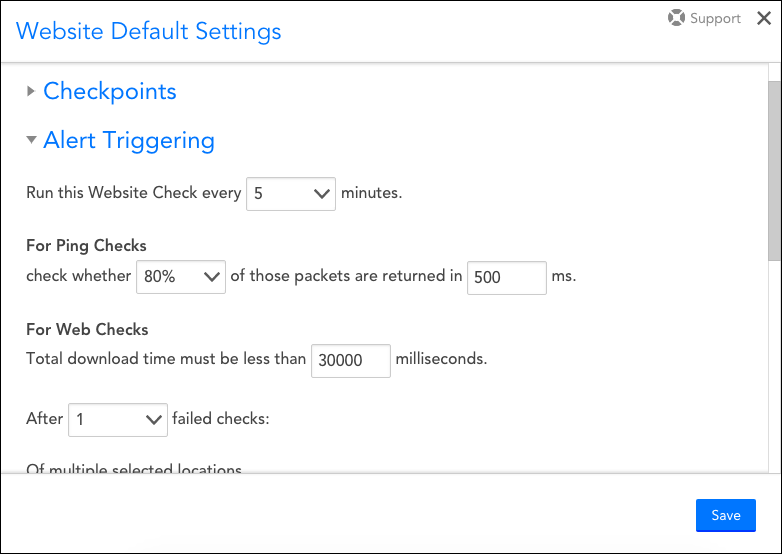
Ping checks
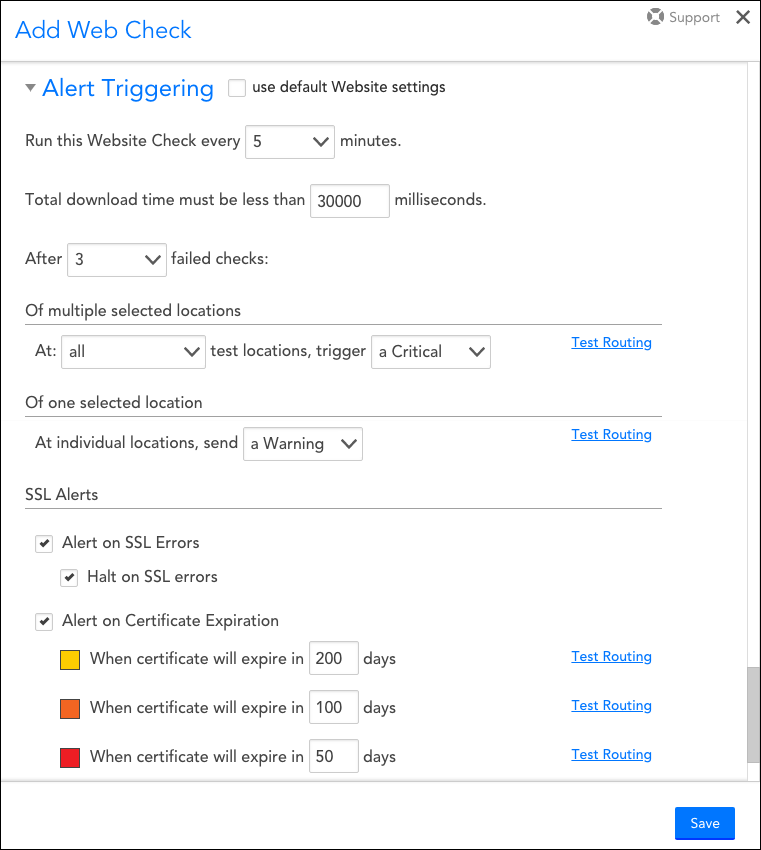
Website downtime alerting
Trusted by:


On-demand Demo
Proactive monitoring for websites and beyond
See our platform in action with a quick on-demand demo highlighting architecture, logs, the AIOps early warning system, topology mapping, alerting, and website monitoring.
See what our customers say about us
Track your company’s network and devices with LogicMonitor.
It’s great since we don’t have to install bothersome agents on the devices or hardware that we want to monitor. I didn’t even need to consult the instructions or contact customer support when I wanted to add a device; the process is simple and easy to follow.
Feb 12, 2024
The tool for strategic Managed Services partners
SolarWinds had the big breach just as we left it. We loved how powerful it was, and how customizable – however, it is an ON-Prem tool, and as a growing MSP, that dynamic didn’t and couldn’t scale.
Nov 21, 2022

Help businesses spend less time on manual tasks and consolidate existing tools
LogicMonitor dynamically scales with our network’s growth. Whether we add new devices or expand into the cloud, the platform adapts seamlessly, eliminating the need for constant manual configuration. Excels in providing comprehensive visibility into our network infrastructure. It auto-discovers devices and monitors various network components, including servers, switches, routers, and cloud services.
Sep 22, 2023
Website monitoring benefits
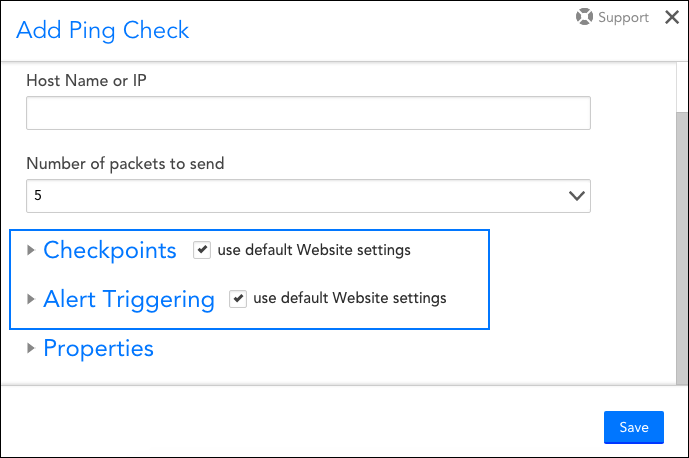
Ping Checks
Find out how your website is performing by monitoring trace route, status, maximum/minimum/average round trip tips, number of sent and received packets, and more.
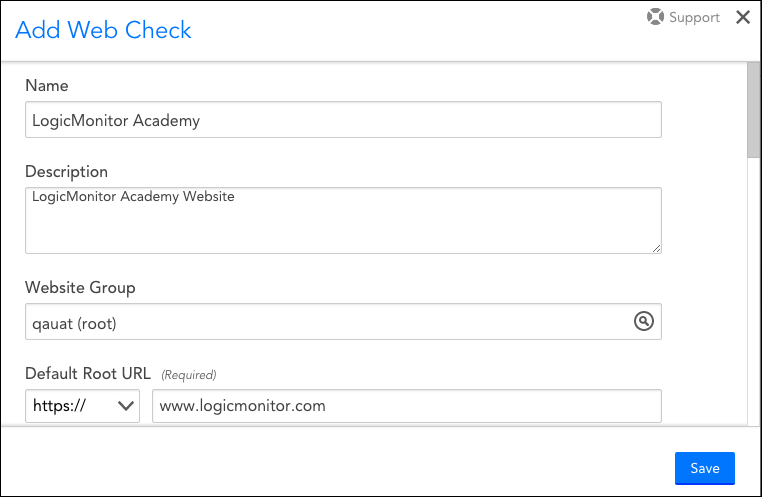
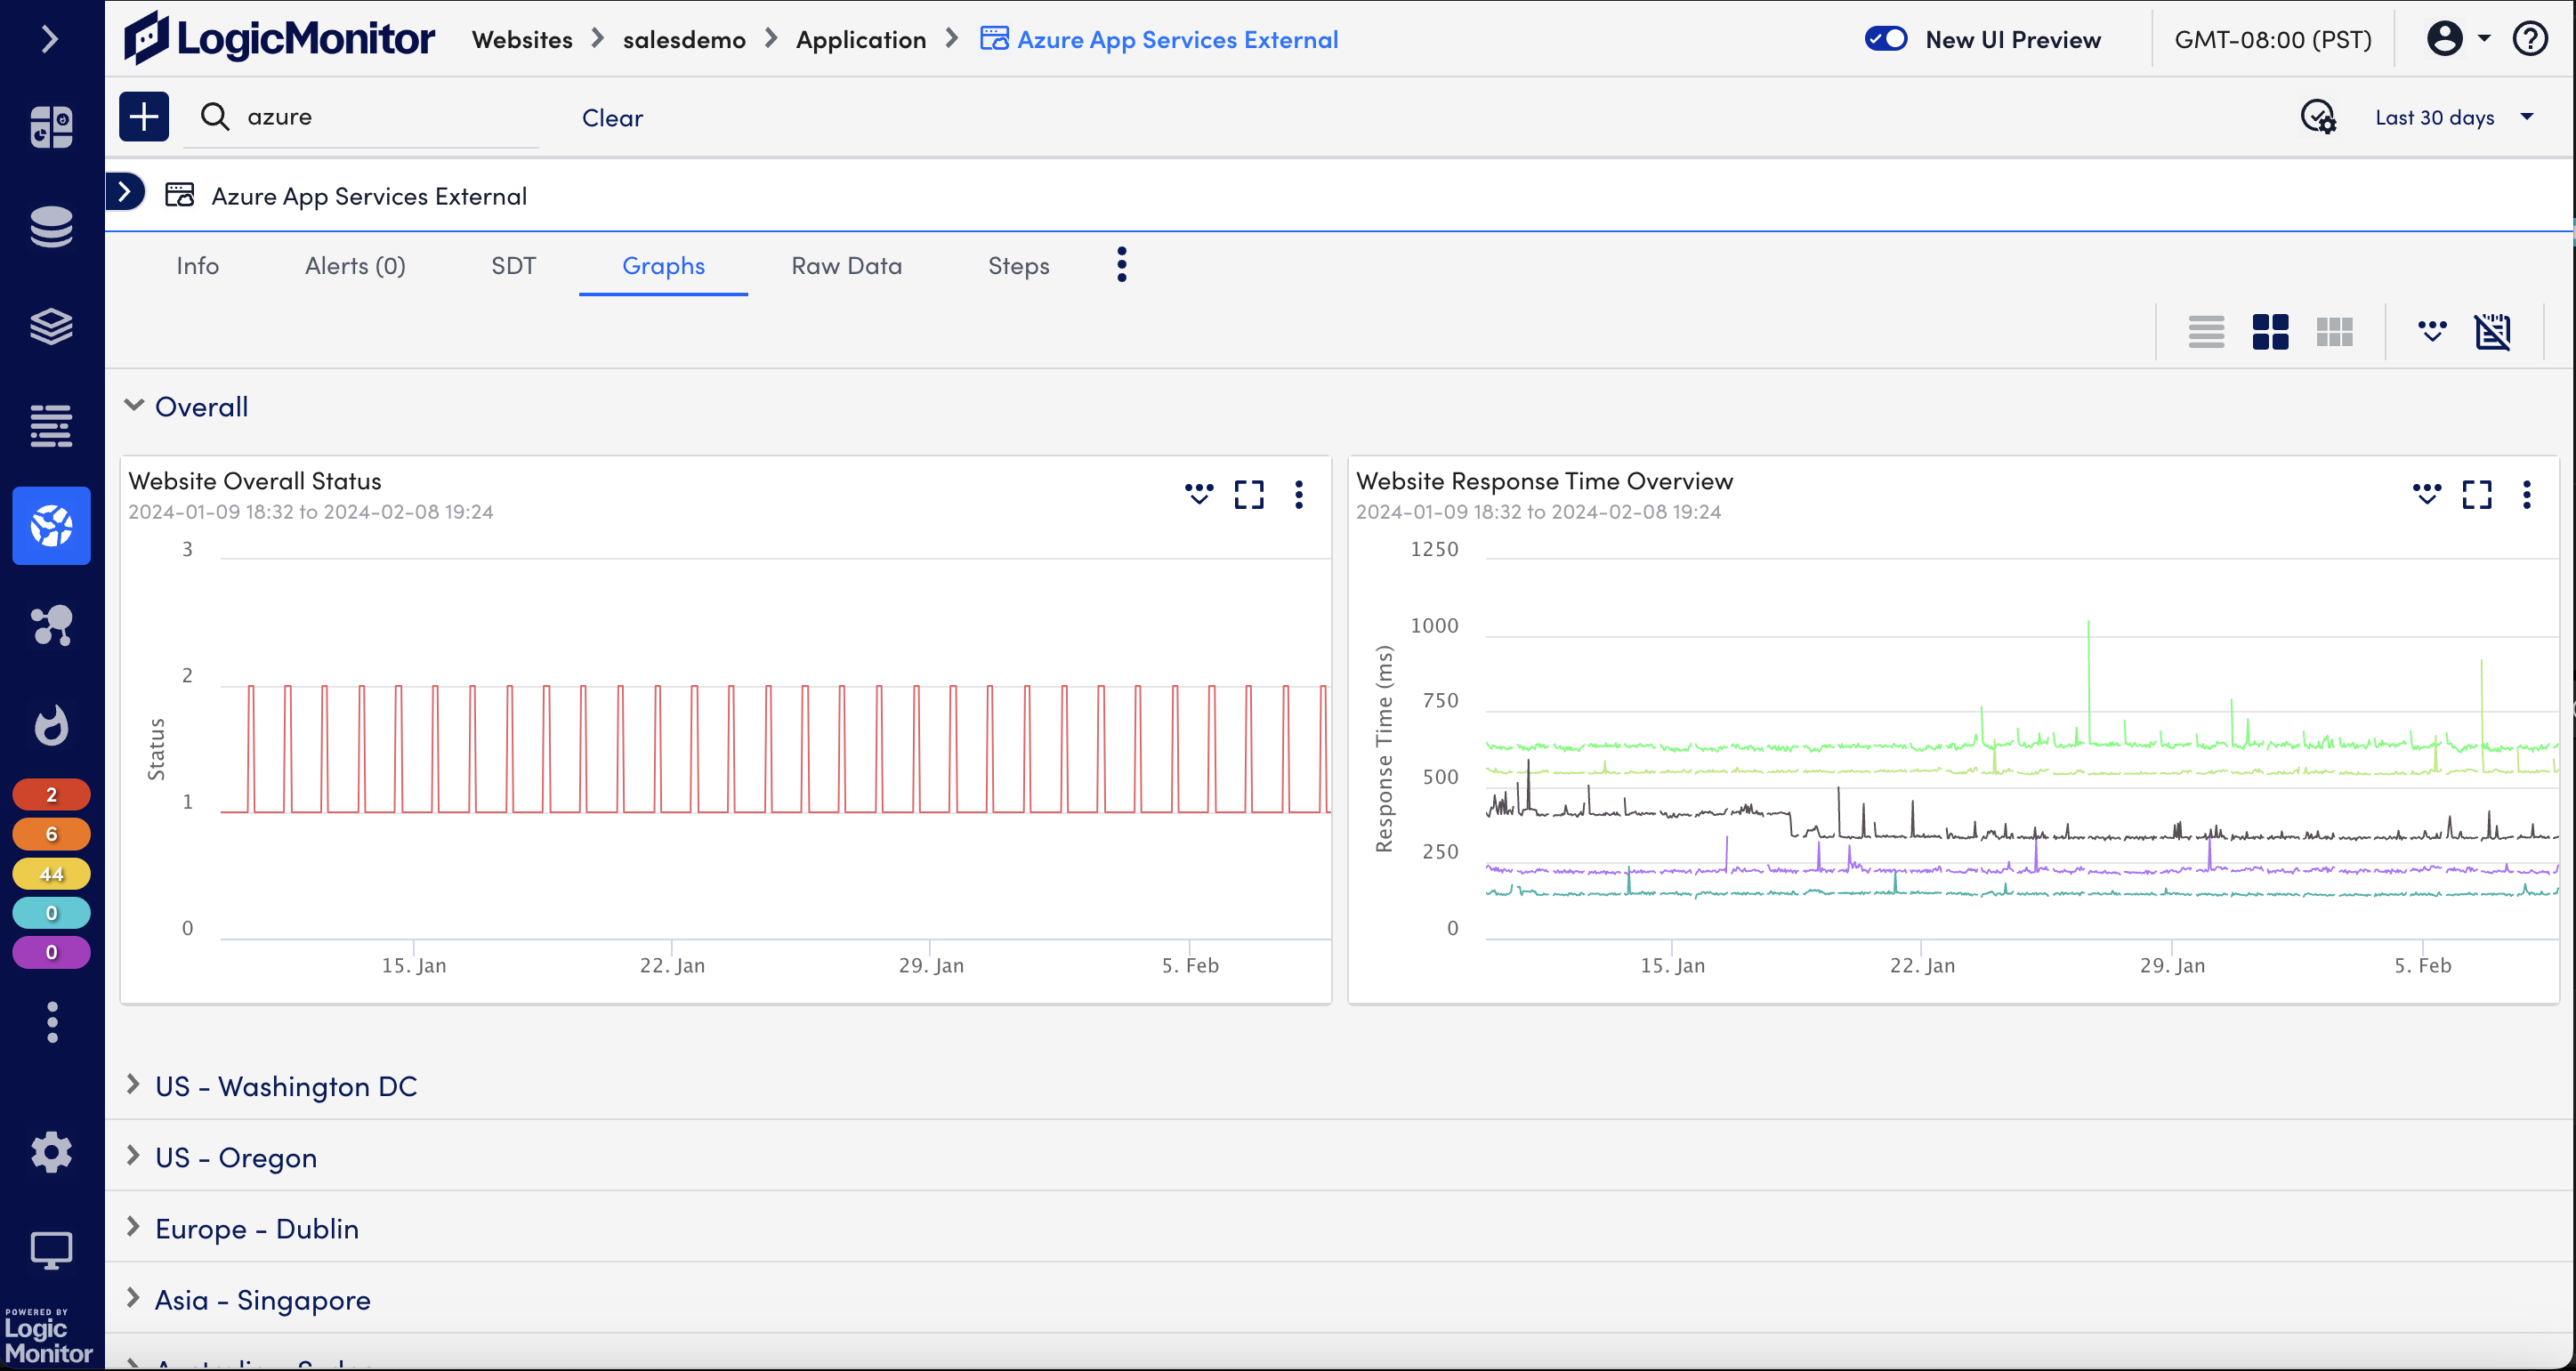
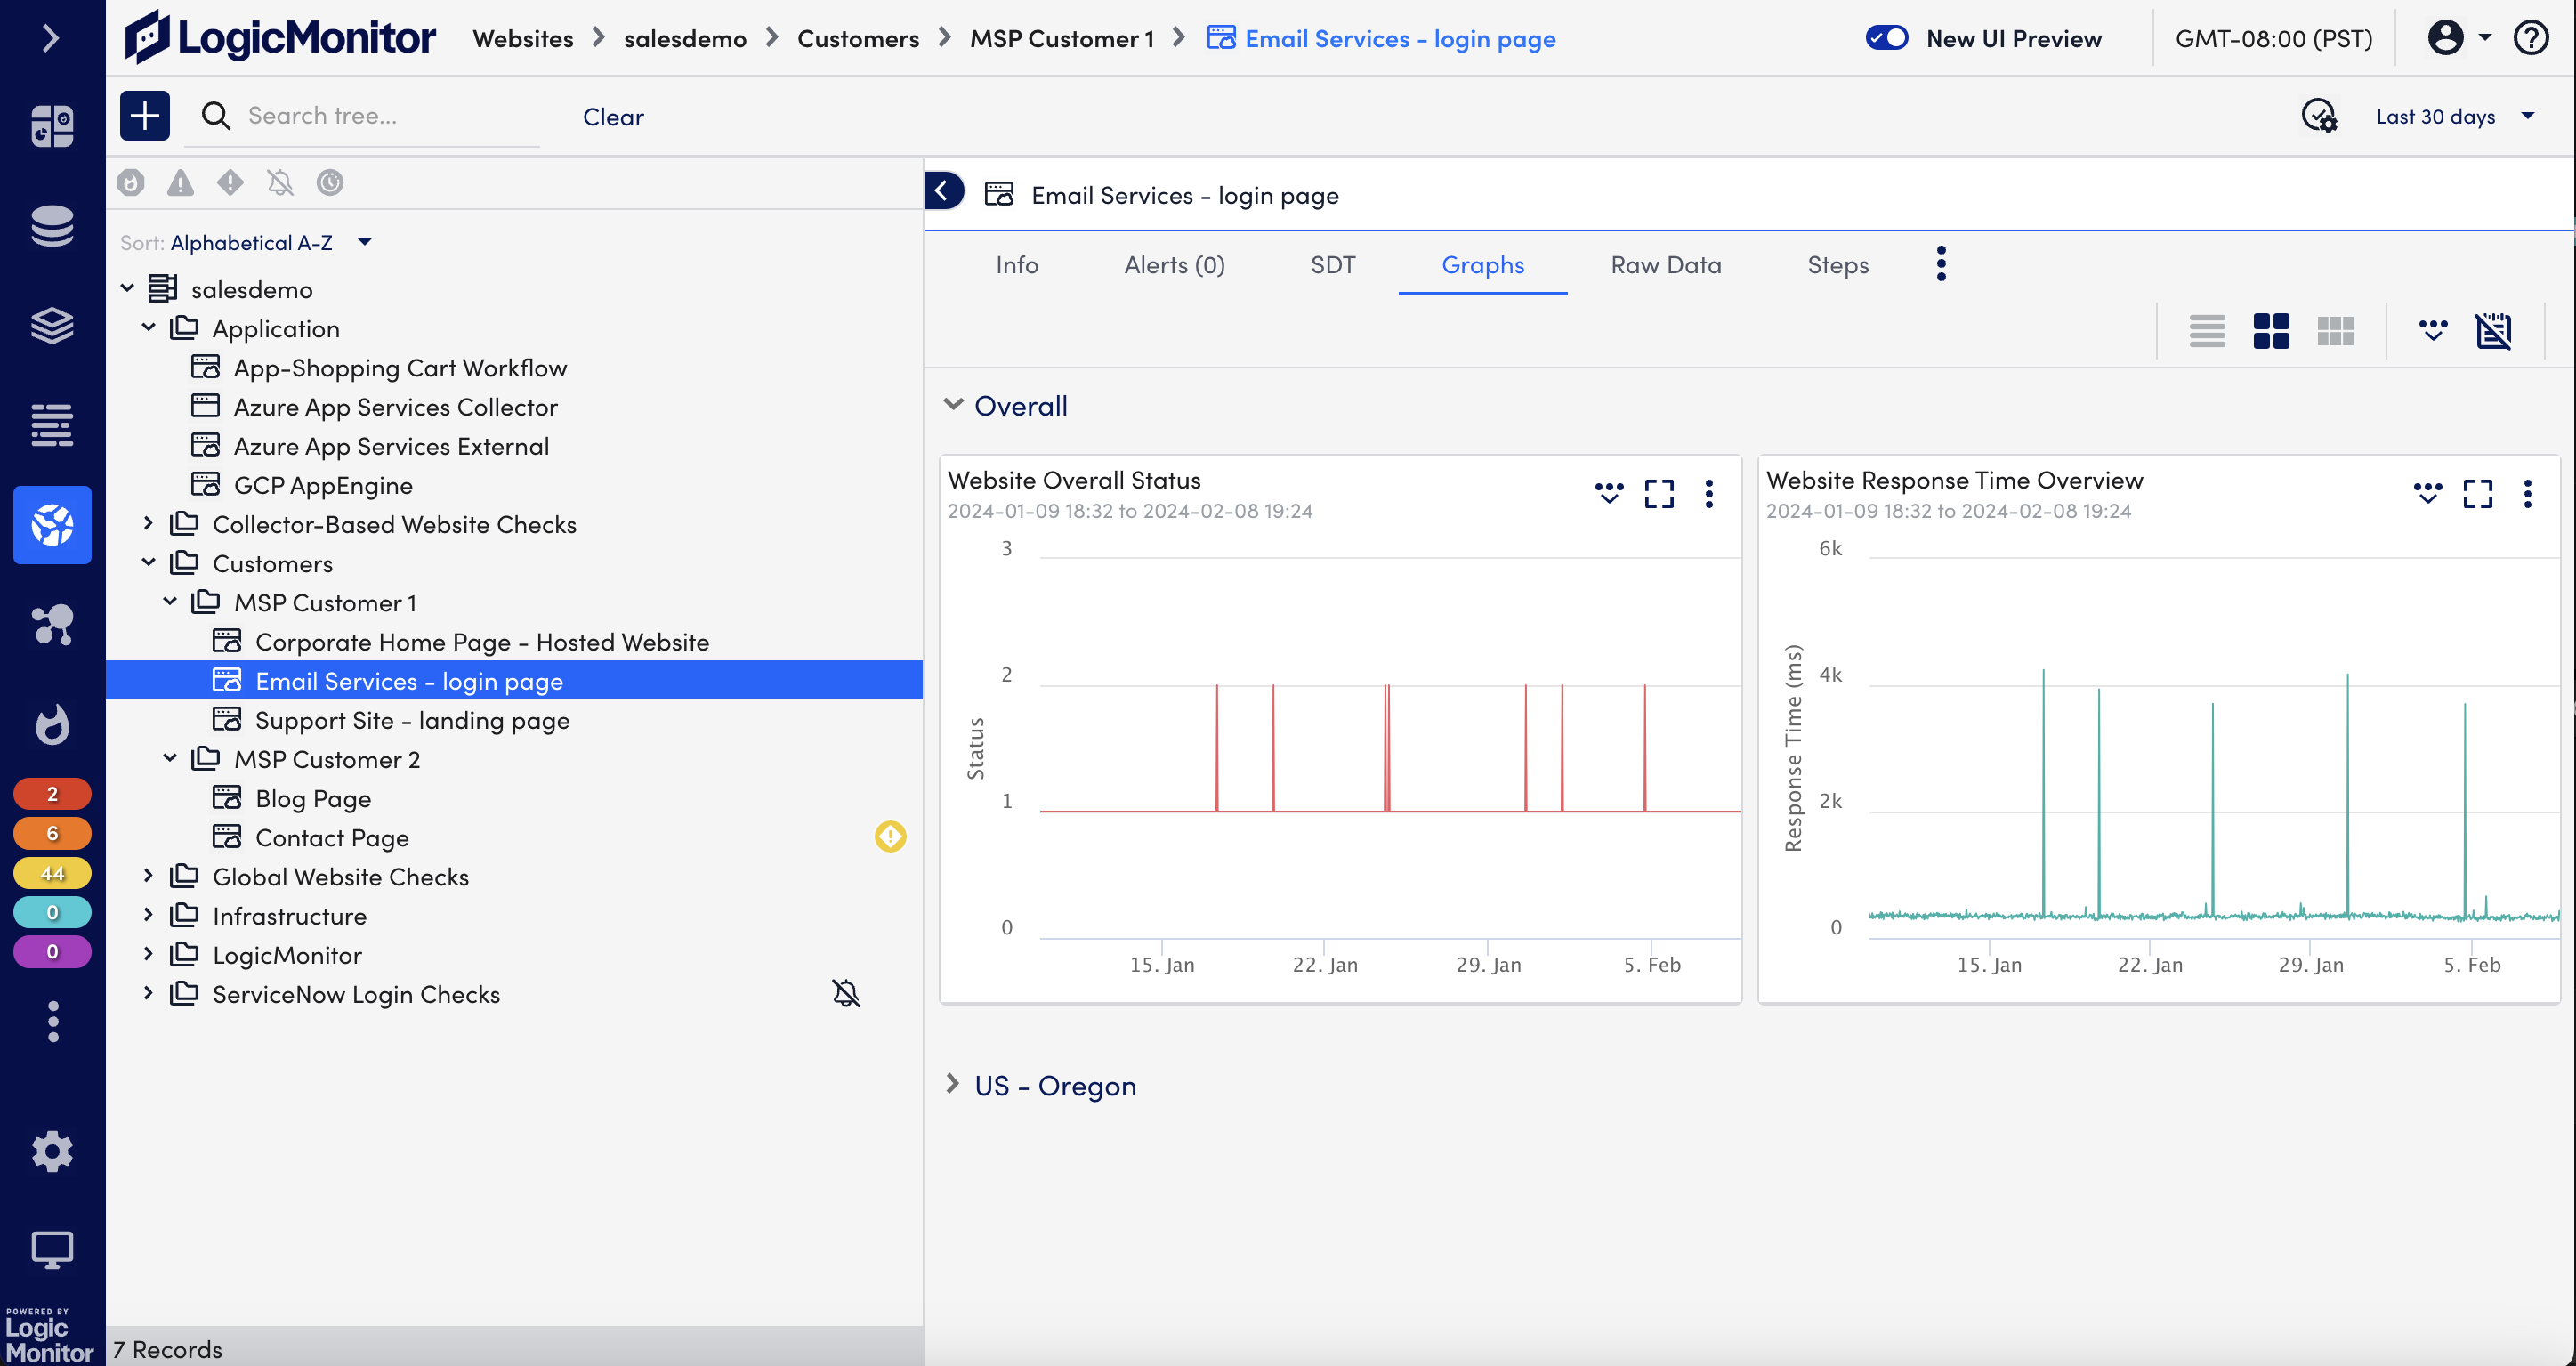
Web Checks
Monitor response time, status, read time, SSL handshake time, SSL status, connect time, DNS resolve time and more!
Deploy Rapidly
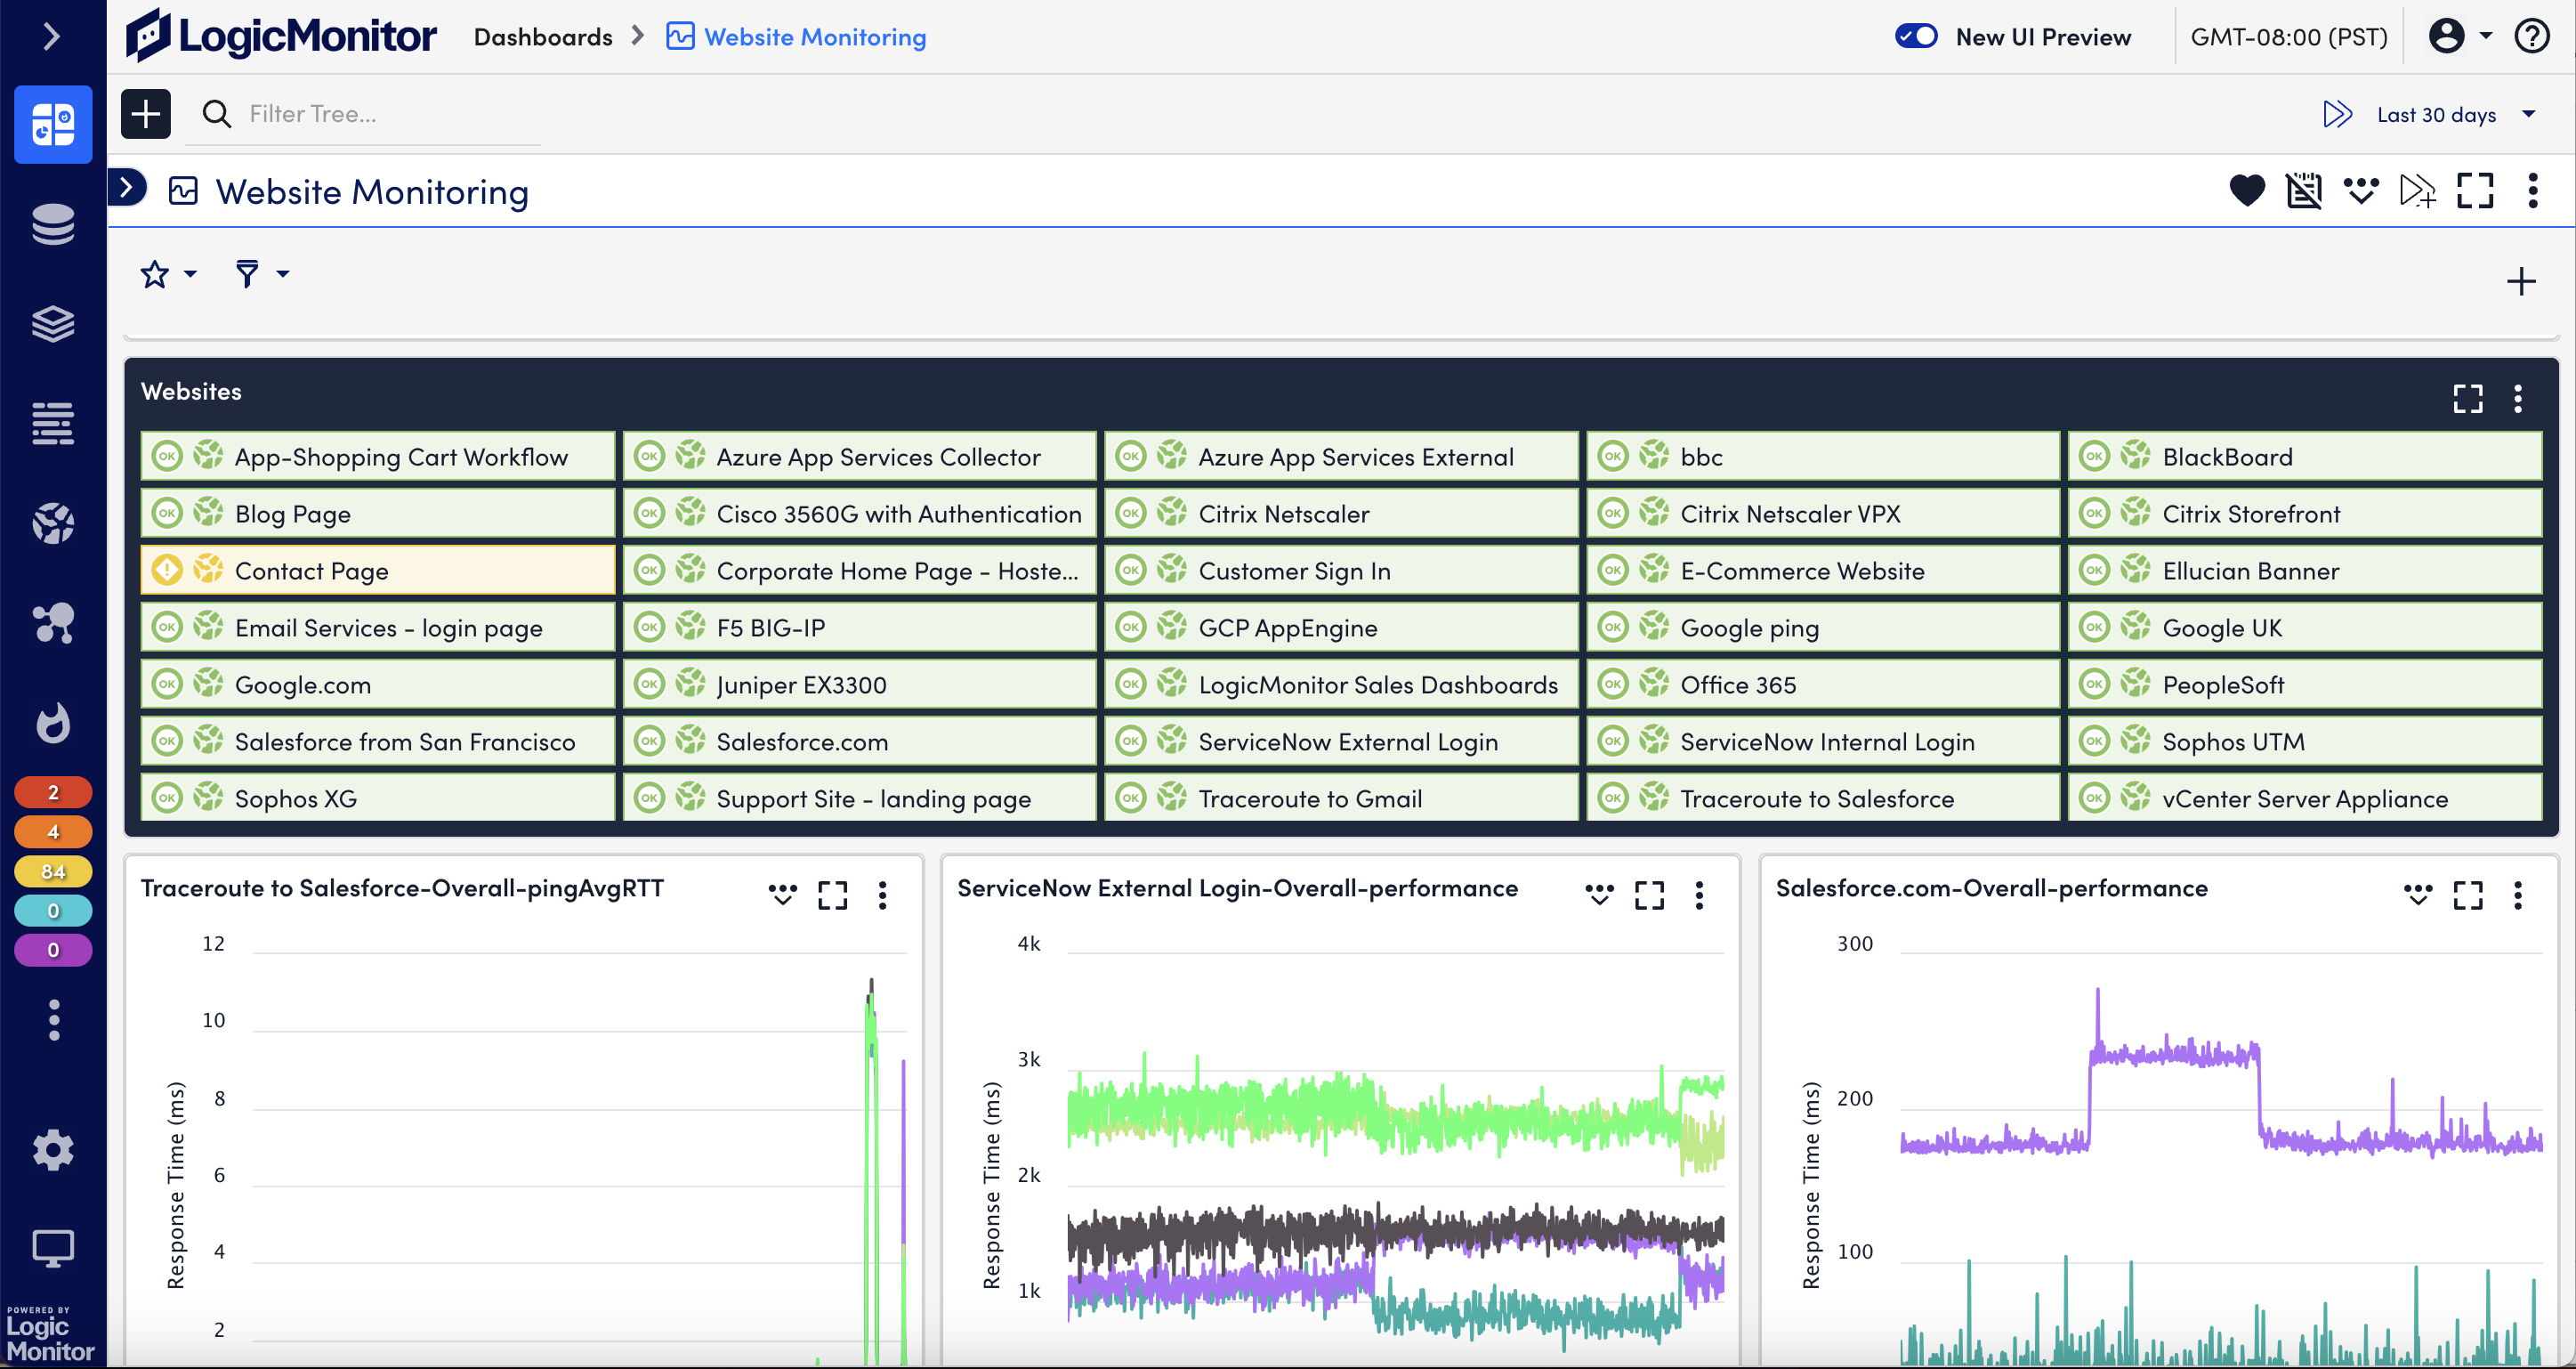
LogicMonitor comes stock with best practice dashboards and alert thresholds for your website checks. Within minutes you will have the data you need to graph, alert, and optimize performance for your internal and external websites from around the world – without installing agents on your web servers.
Reduce alert noise
Put an end to alert storms with intelligent anomaly detection. Distinguish service-impacting alerts from non-service-impacting alerts, and reduce how often you get woken up in the middle of the night.
Identify performance trends
Pre-configured alert thresholds ensure that you receive meaningful alerts right from the start, and help you to proactively prevent downtime. Easily tune thresholds on a global, group, or object level.
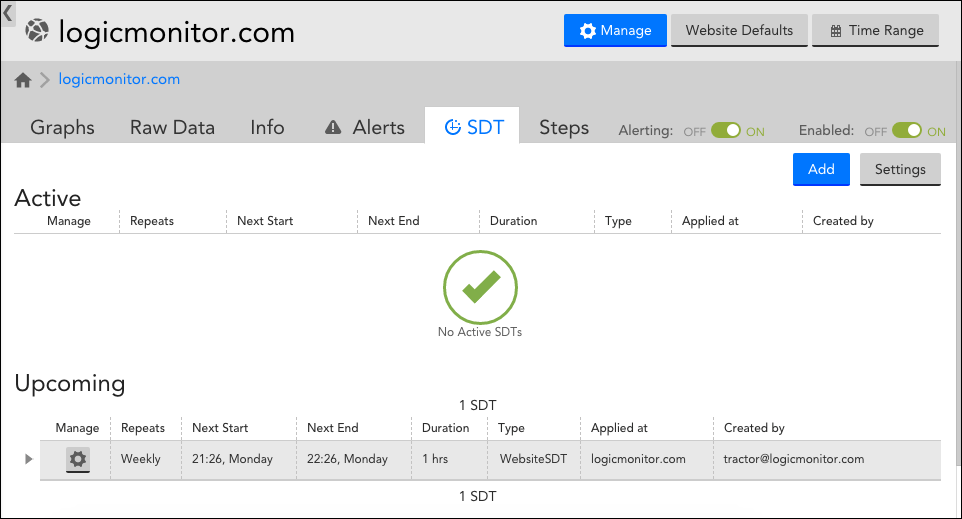
Set scheduled downtime
Set scheduled downtime (SDT) for websites to stop alerts from notifying you, while still showing records of what alerts were triggered during your downtime
Related solutions


FAQ
- What is website monitoring?
Website monitoring monitors website accessibility and functionality as experienced by the general public via external web checks, and website accessibility and functionality as experienced by your business’ internal users via ping checks.
- What is synthetic monitoring?
Synthetic monitoring is an approach to website monitoring where a website (or web environment) is tested by simulating a site request, such as availability.
- What are synthetics?
Synthetics are simulated checks used in synthetic monitoring, allowing users to test environments without causing strain to their systems.
- Will gathering web metrics slow my site down?
Gathering web metrics from synthetic web checks and ping checks do not slow a site down
- How is website data collected?
Website data is collected through synthetic transactions, where the results of a simulated test are gathered and recorded
More Resources


network monitoring / 09.27.23
What are web checks and ping checks? Why are they important?
Learn More