Welcome to the LogicMonitor Dashboard Directory!
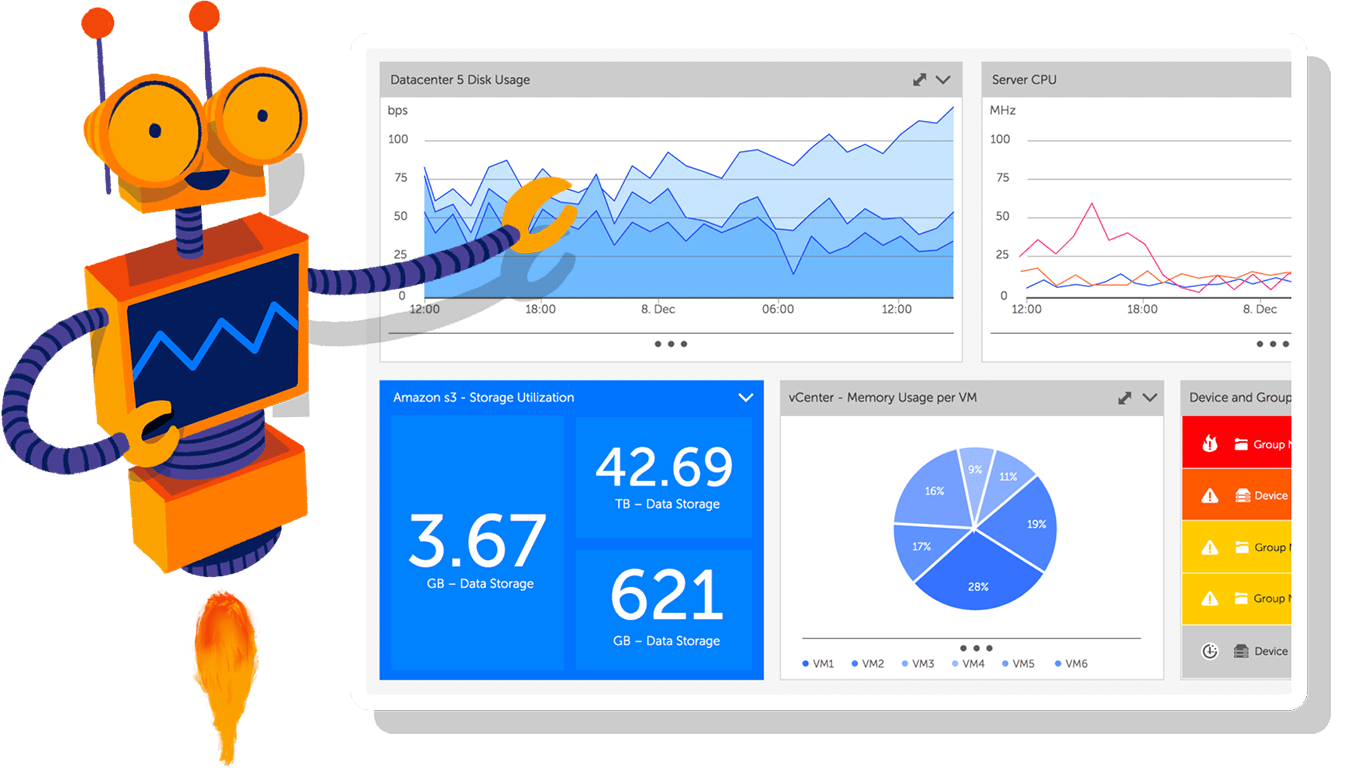
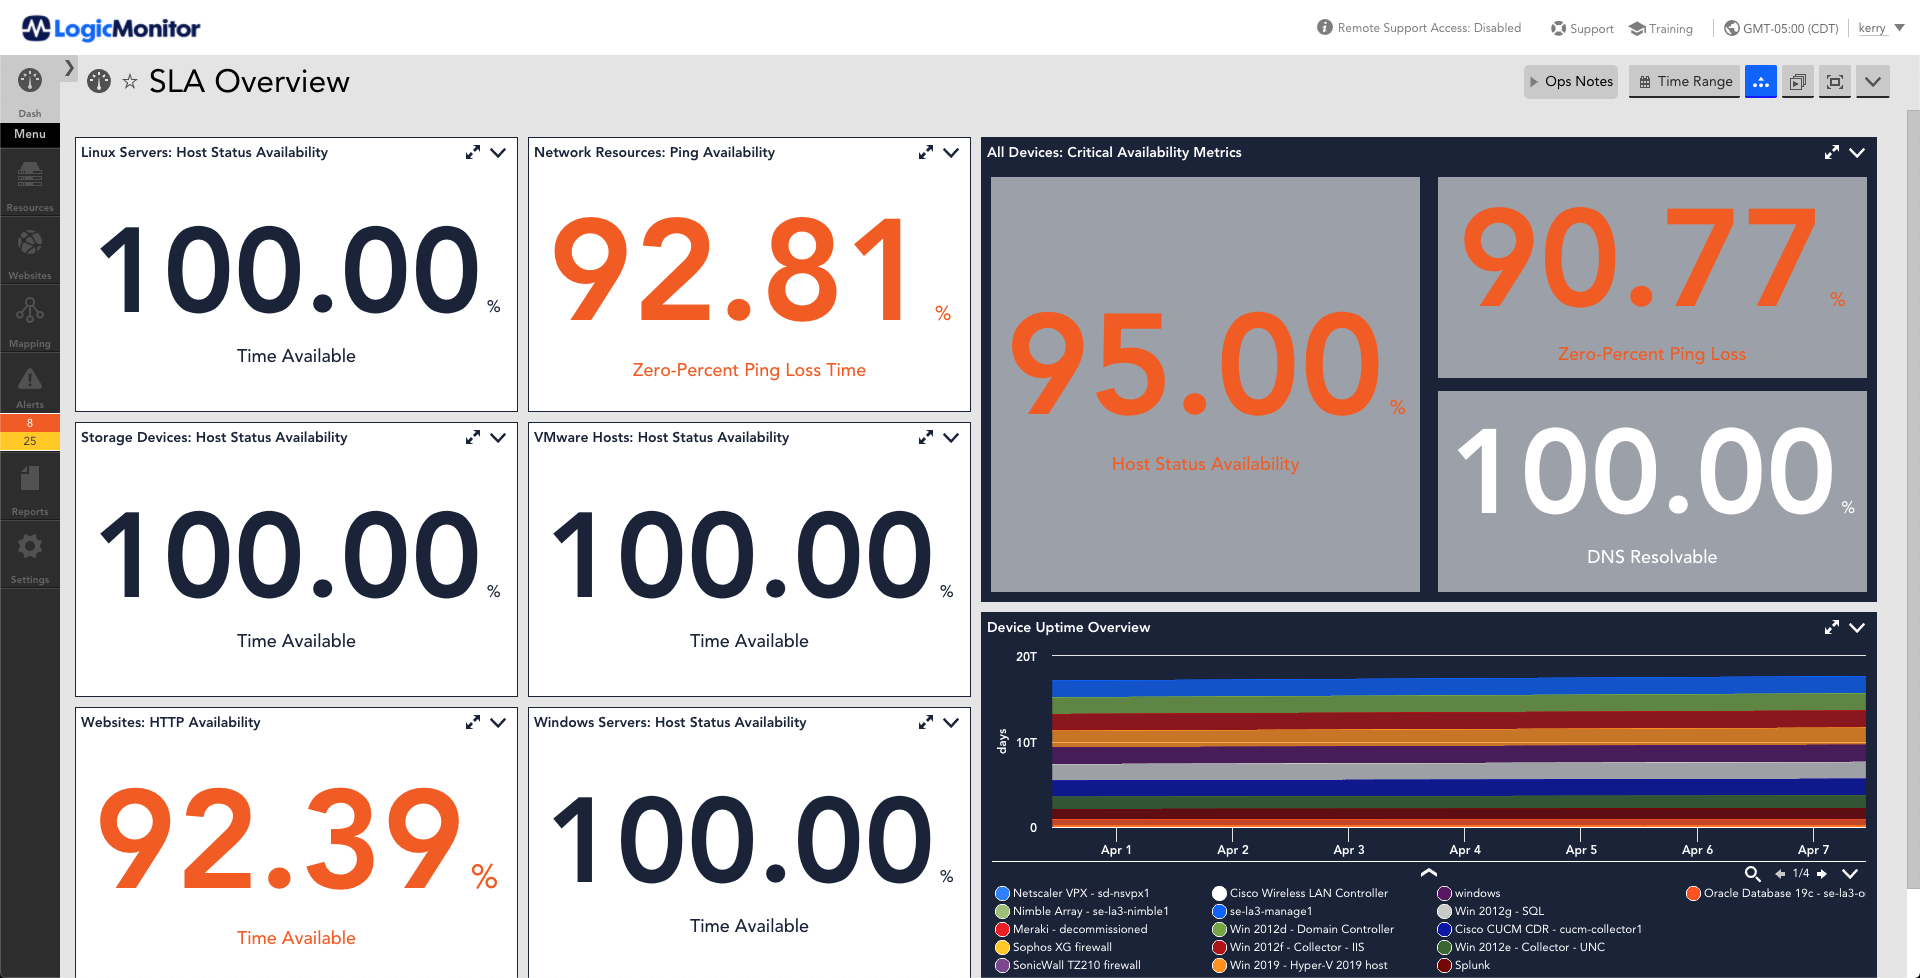
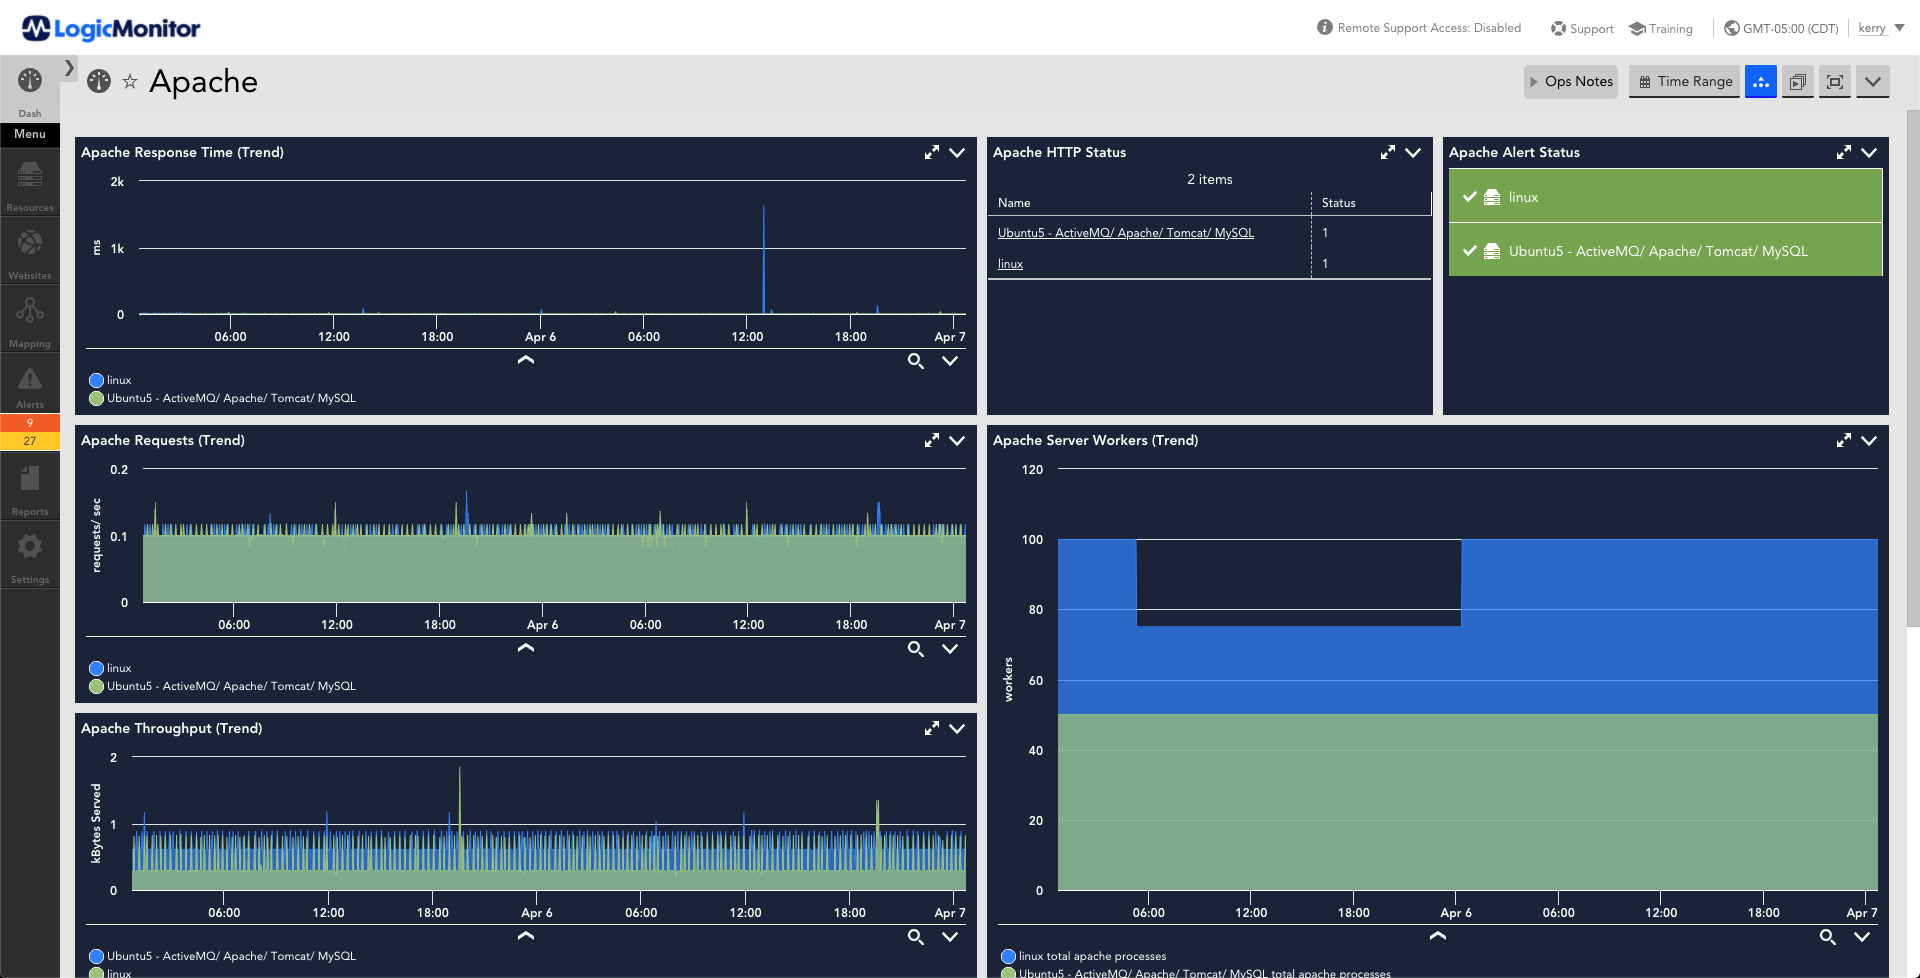
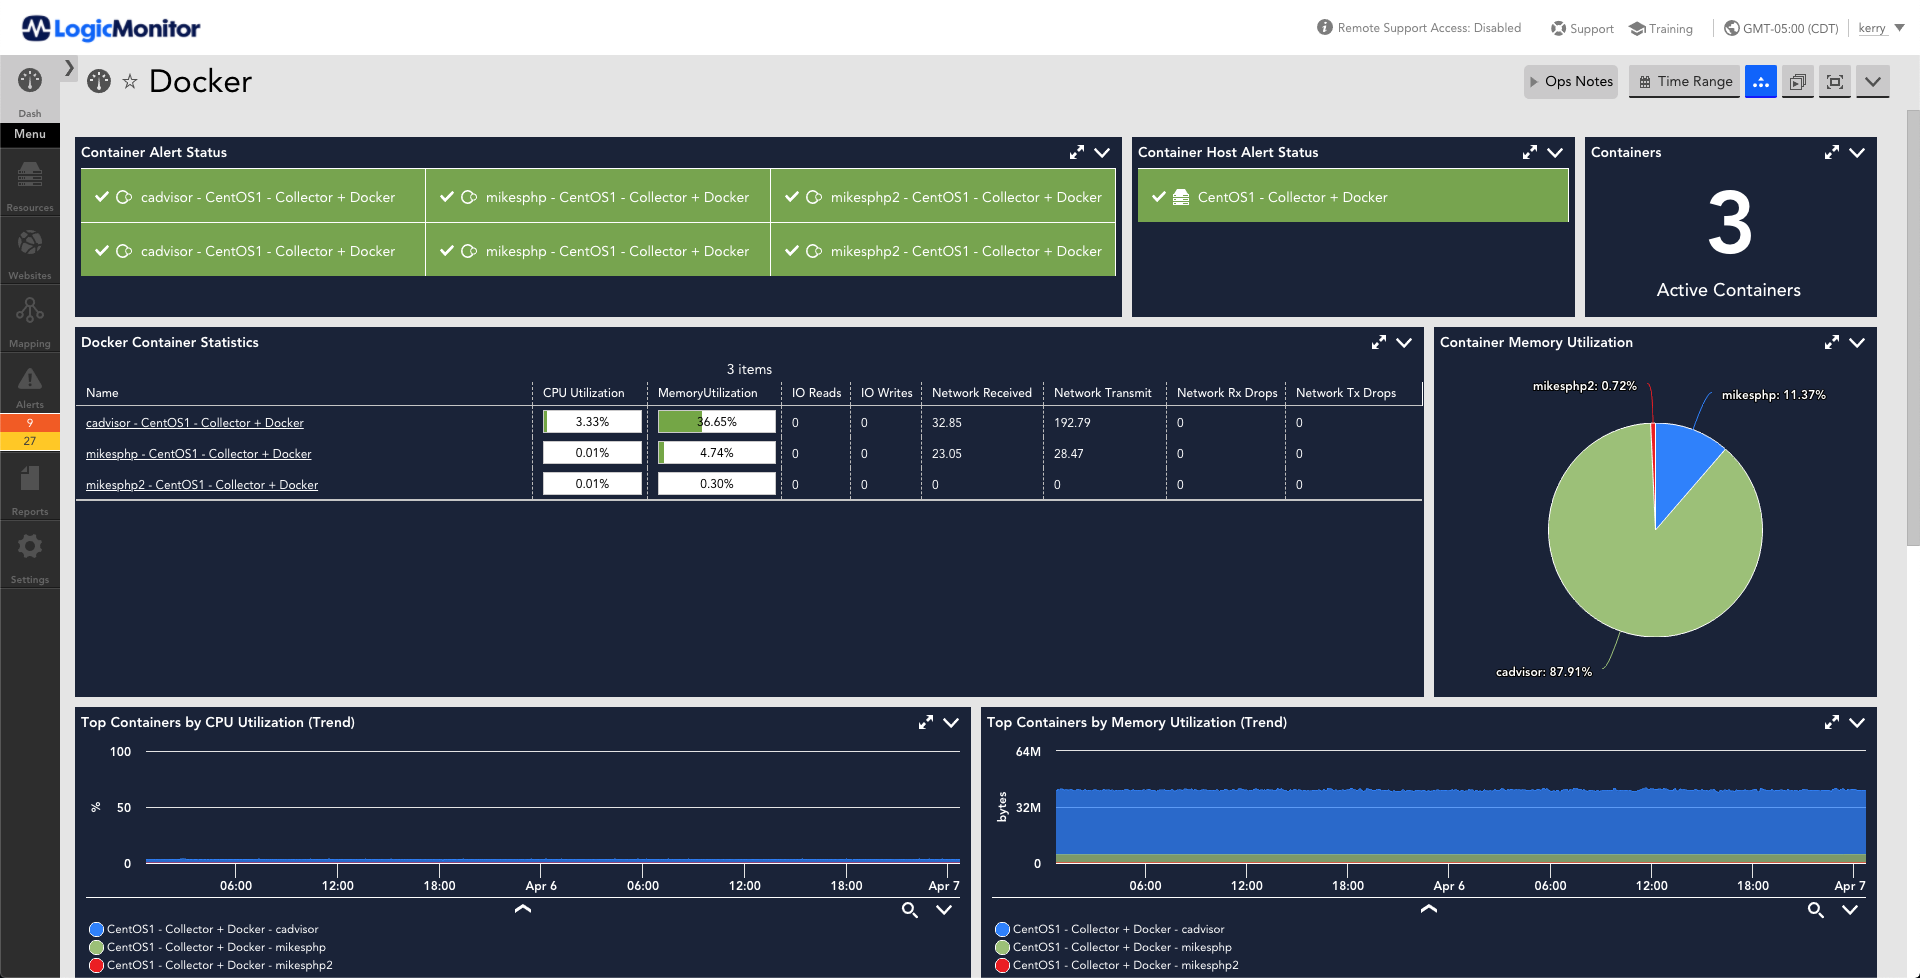
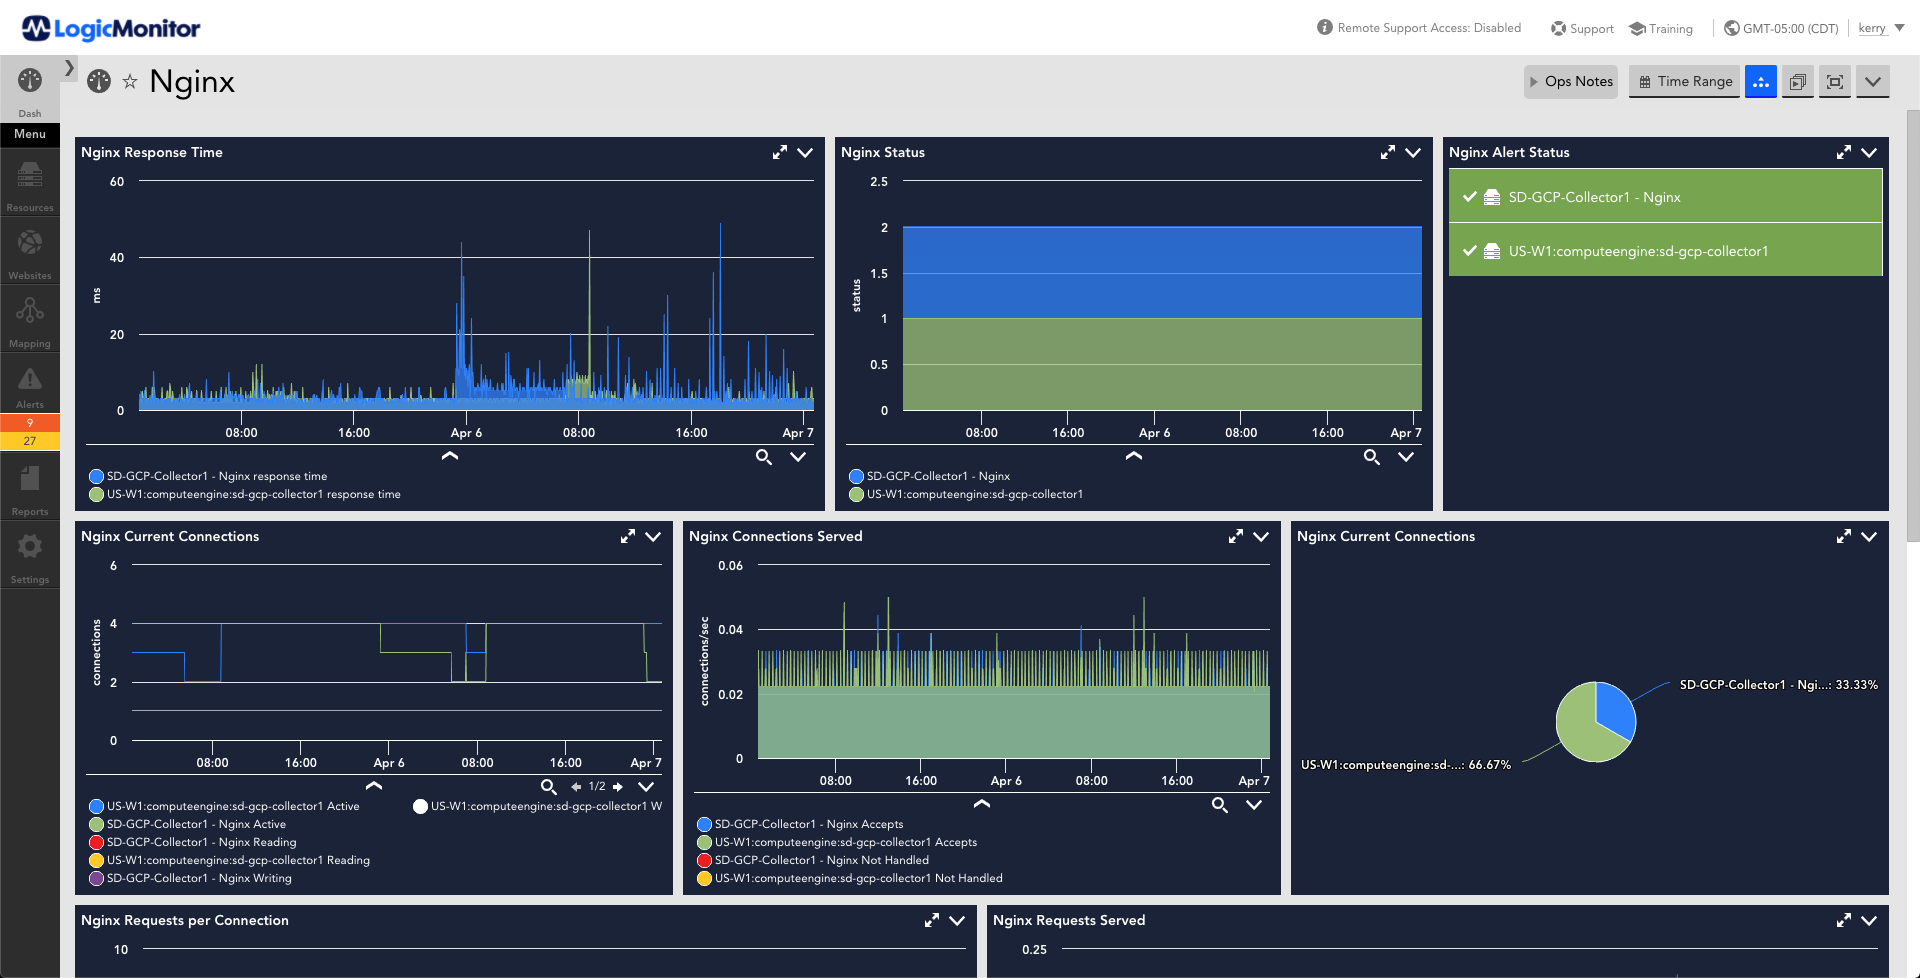
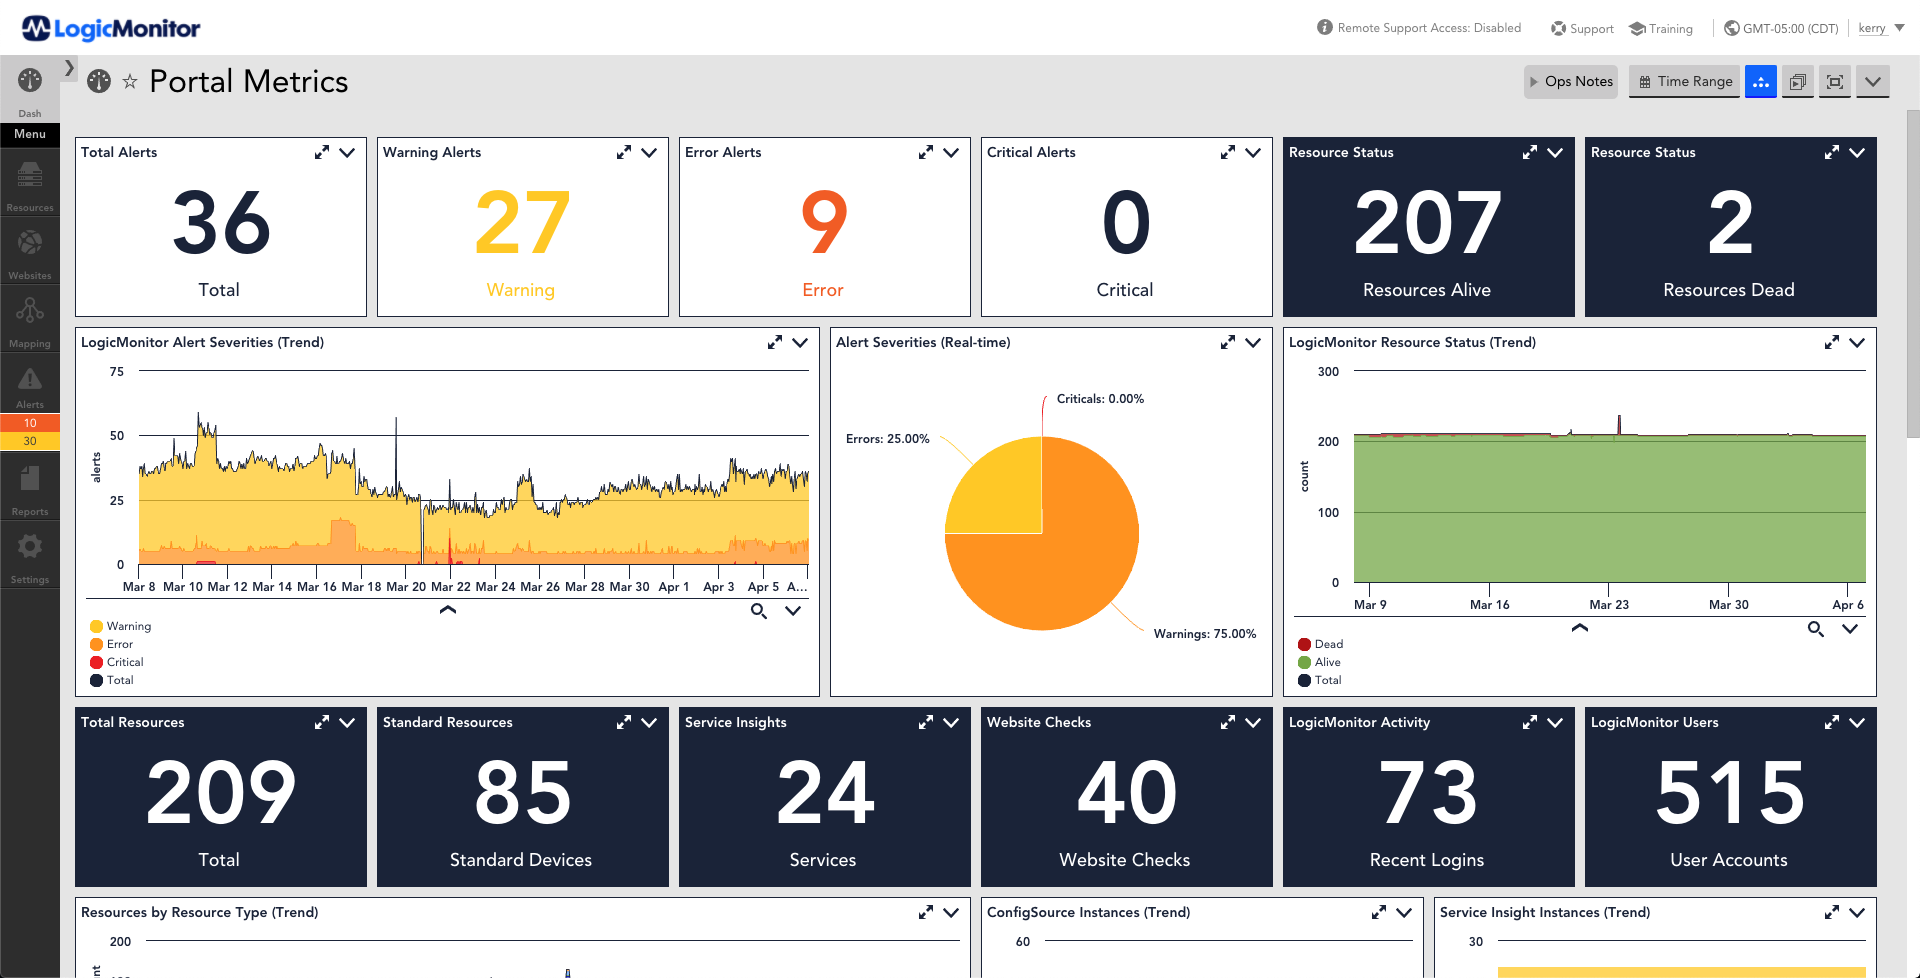
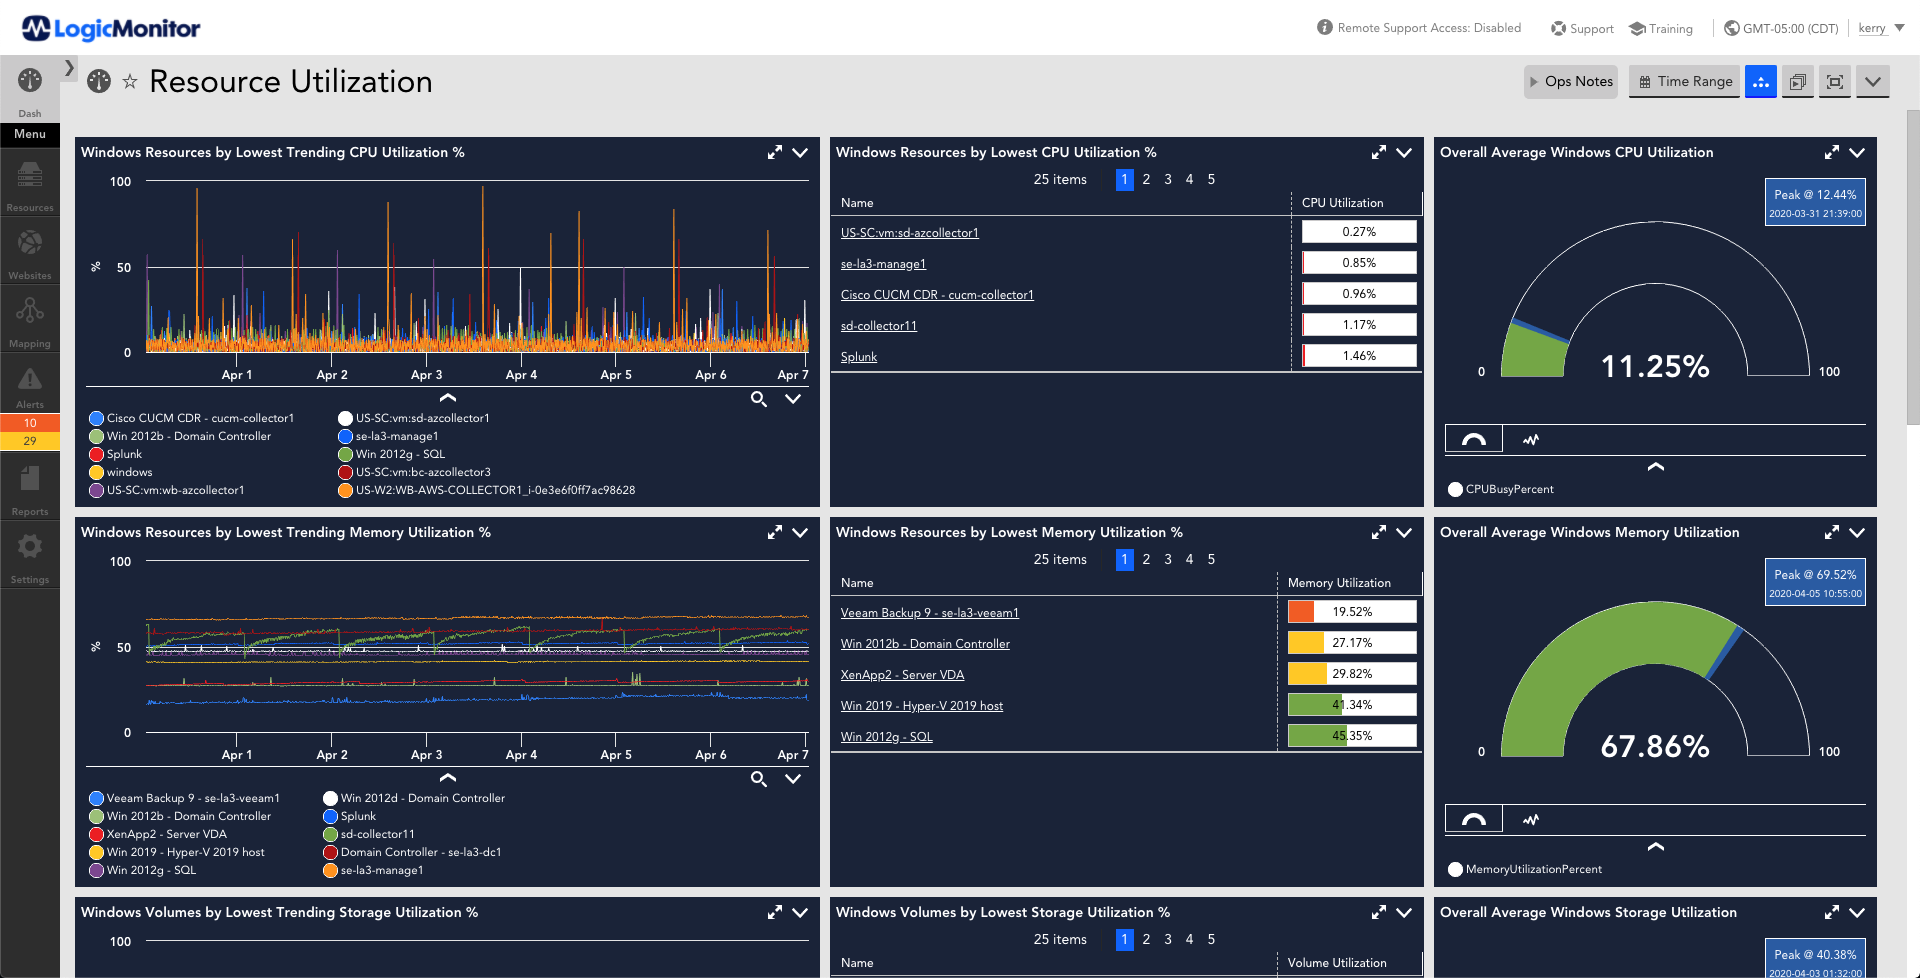
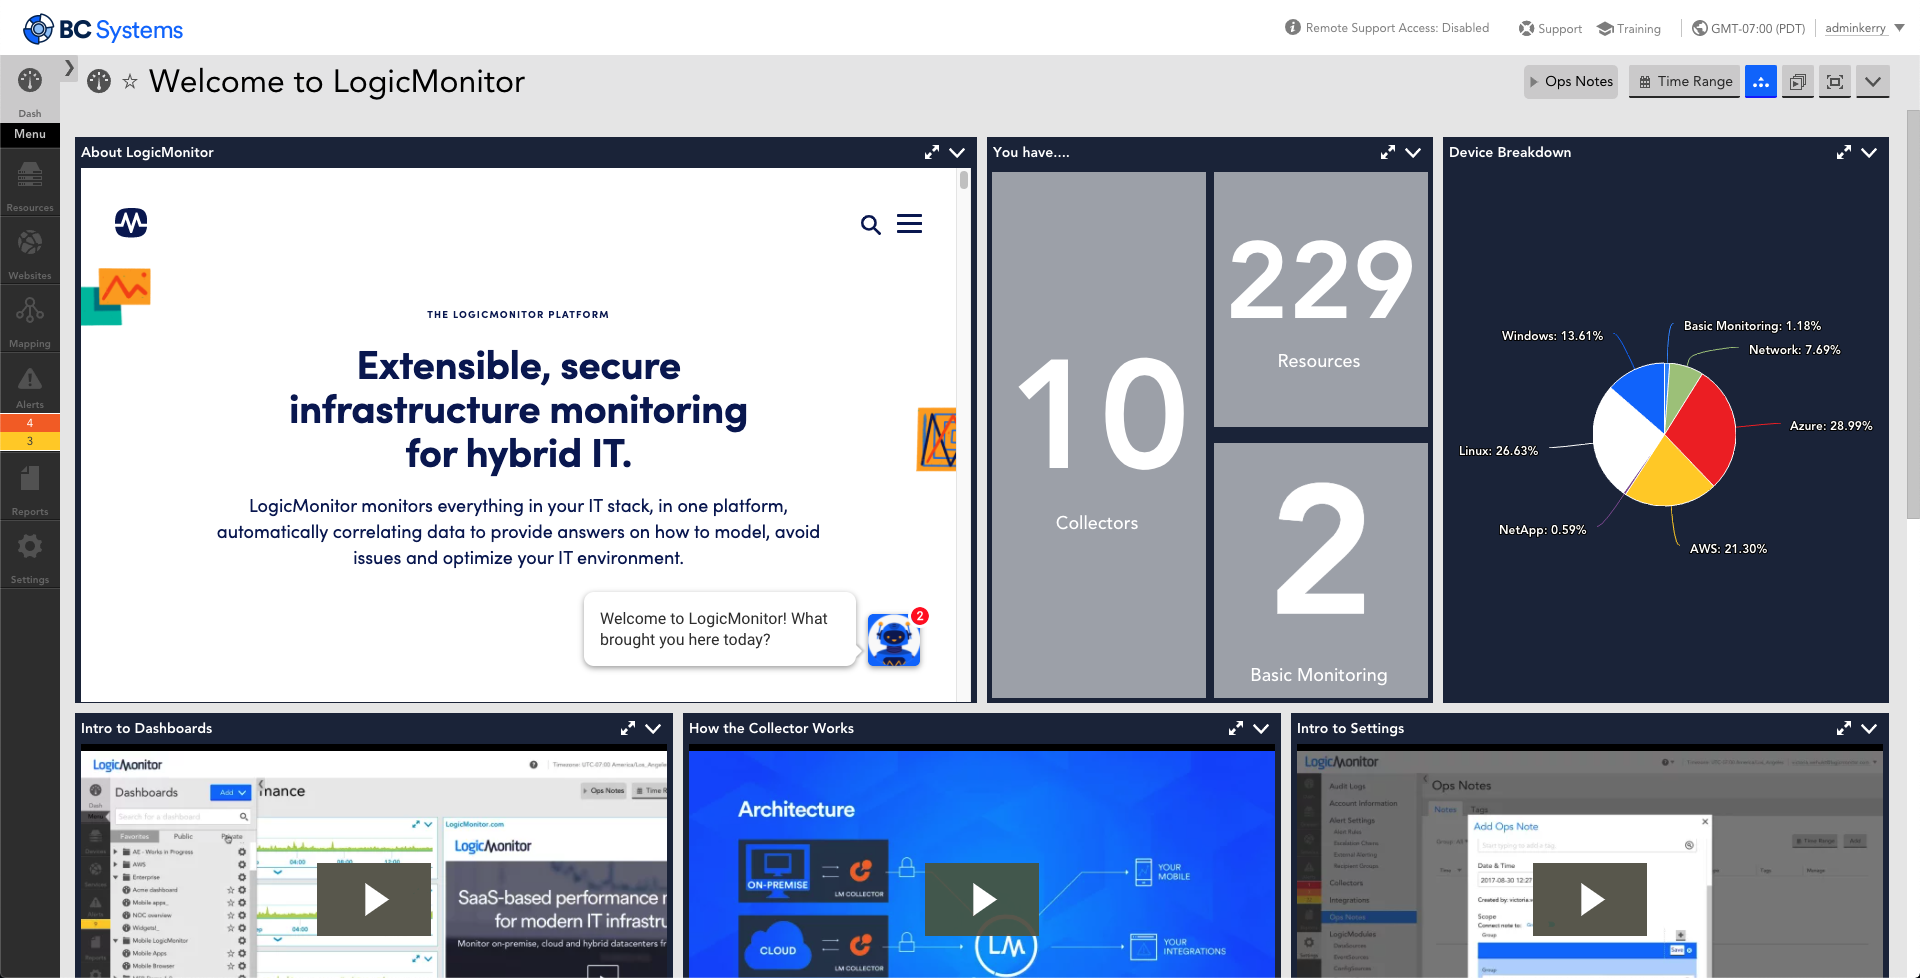
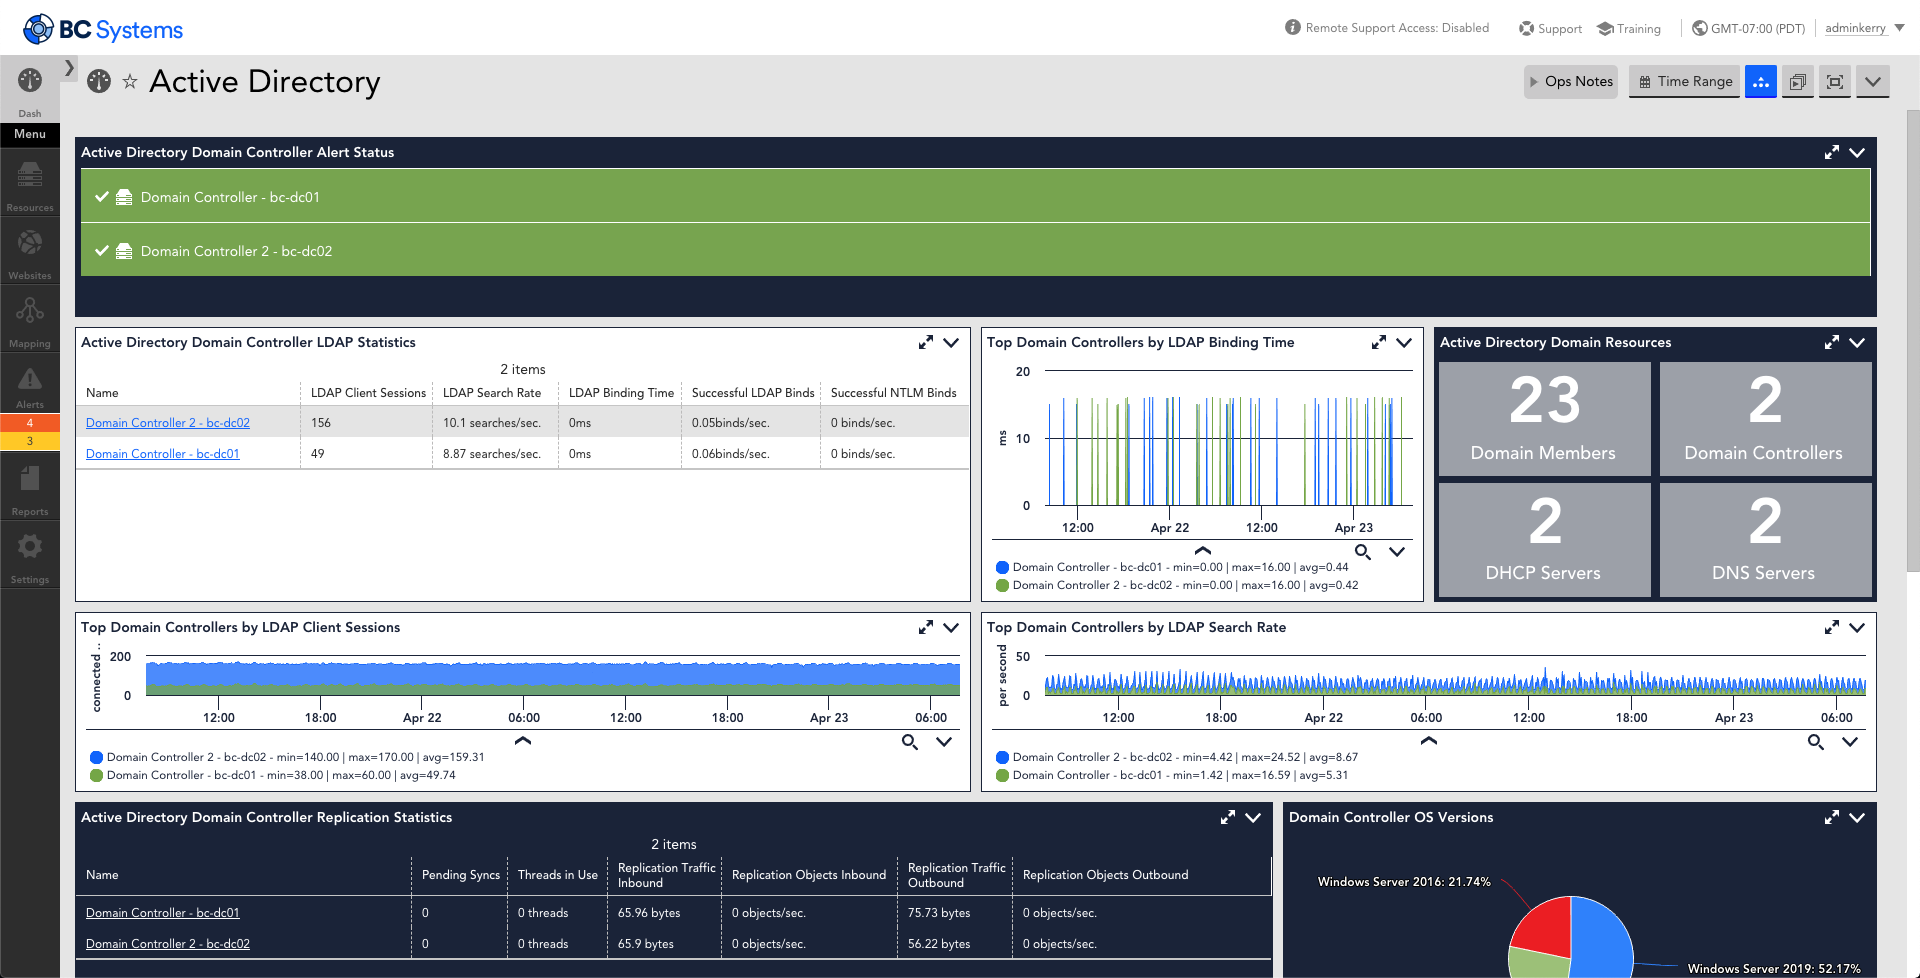
The LogicMonitor dashboards showcased here provide quick and easy visibility into critical metrics that help facilitate rapid issue identification and resolution, and enhance operational efficiency.
Focus: Remote Workforce Visibility
Events in 2020 have accelerated every company's transformation in regards to Work From Home policies and infrastructure. "WFH" is the new normal for the majority of companies, and WFH infrastructure has become more central than ever to employee productivity and customer experience.
Remote Workforce Visibility: Executive Overview
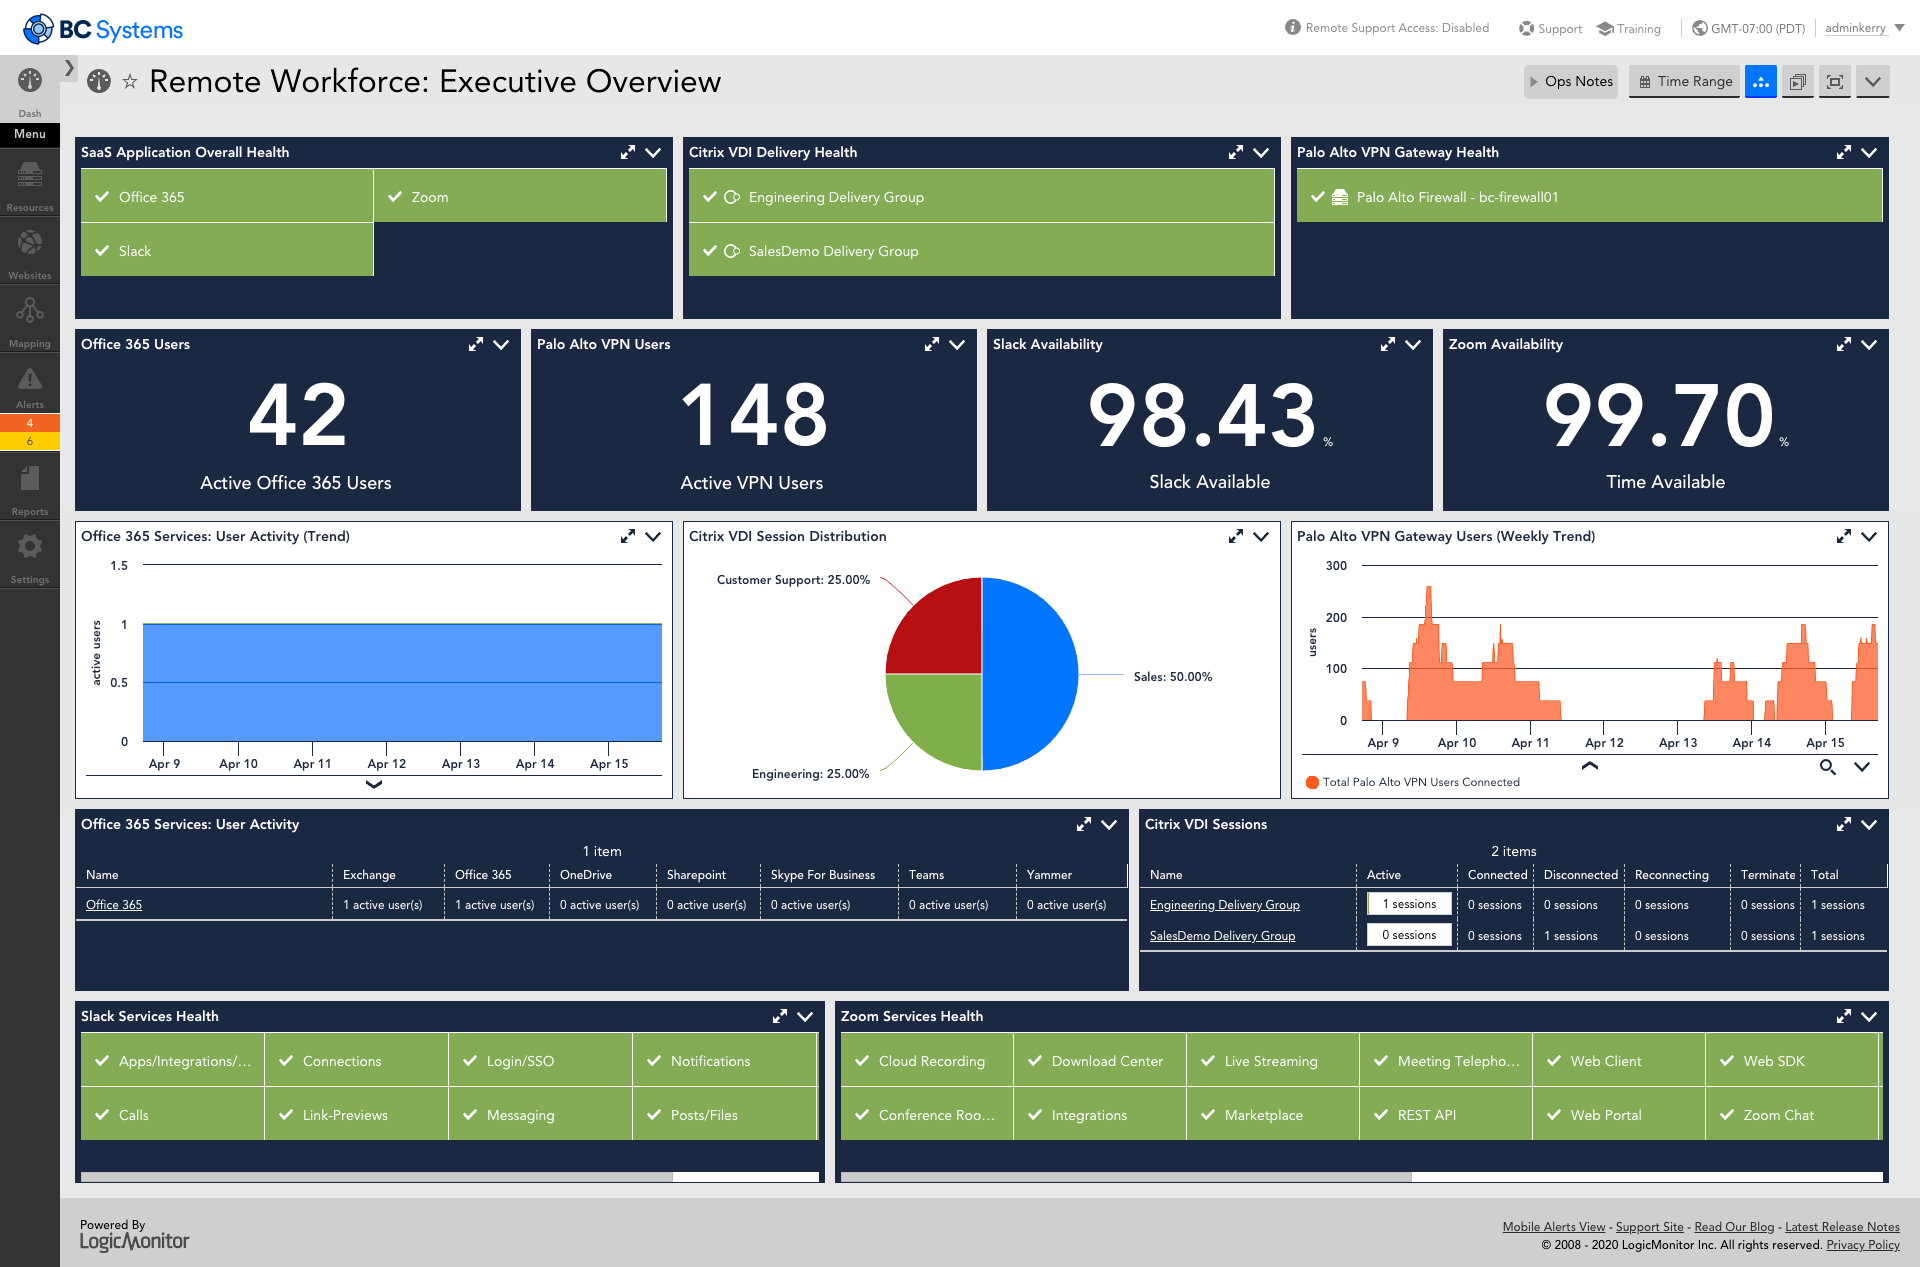
Remote Workforce: Executive Overview
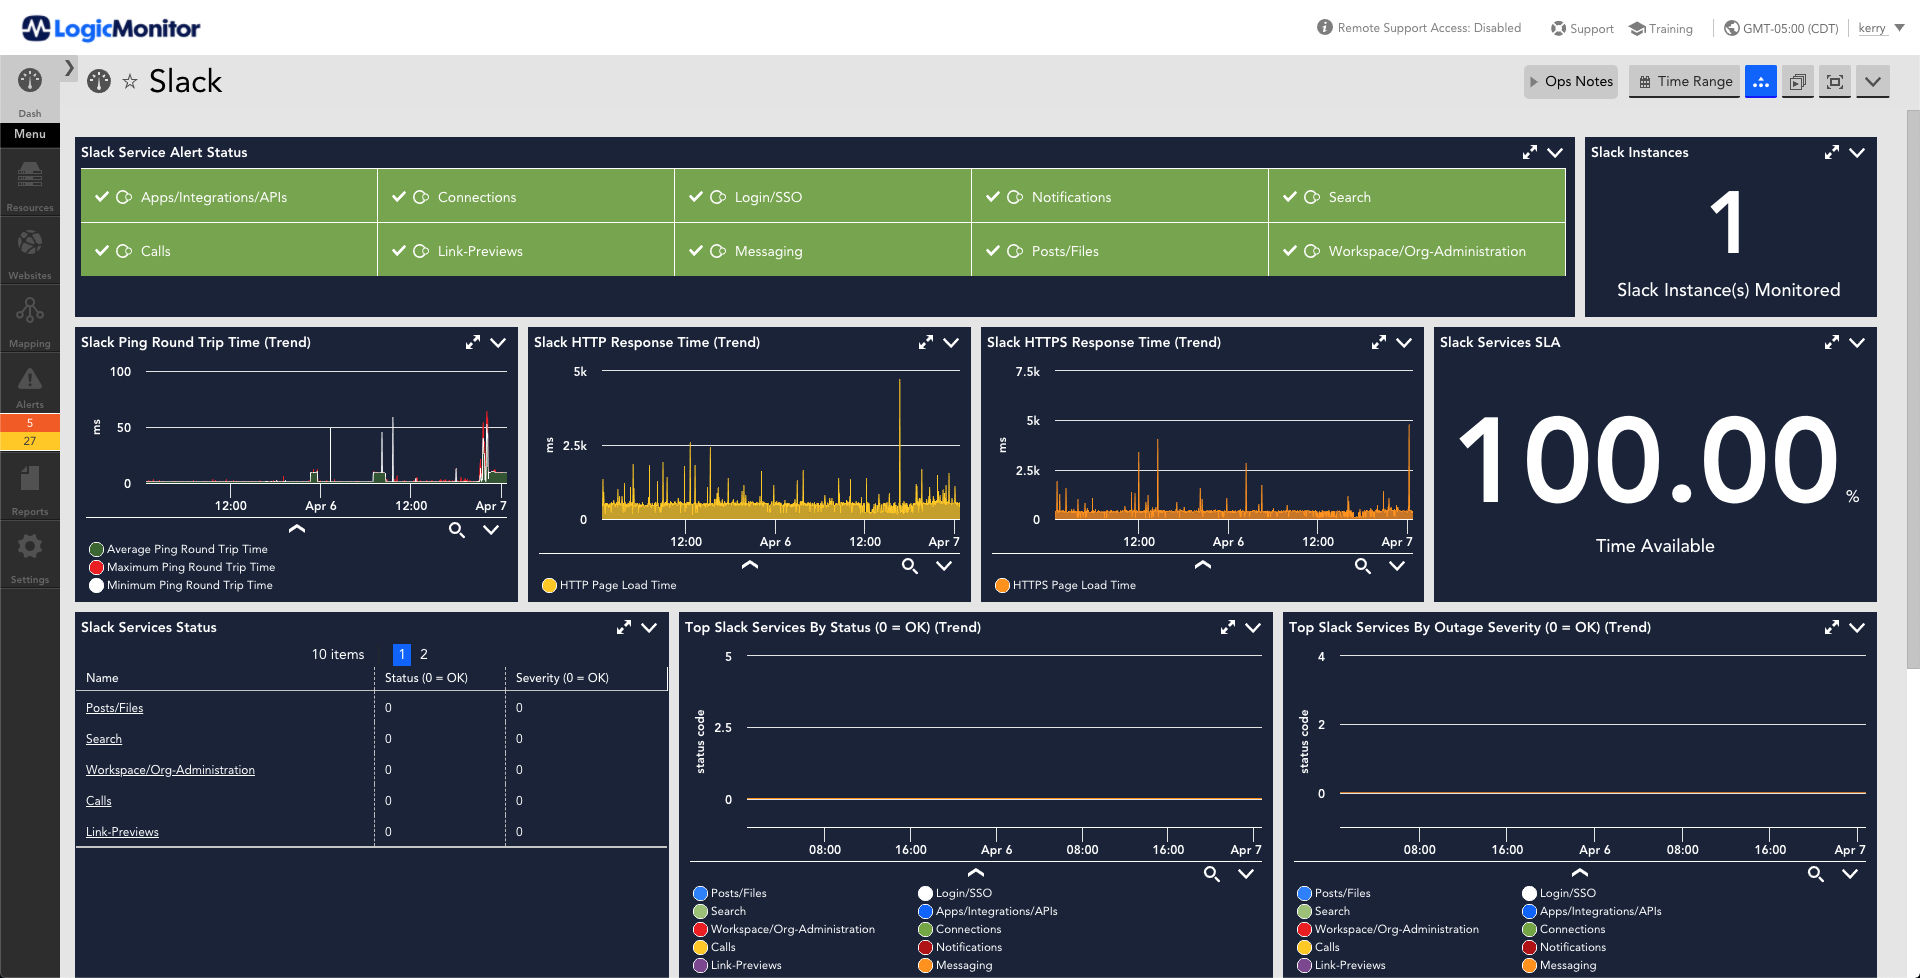
Areas of executive concern have always included customer experience and employee productivity, more important than ever in a WFH environment. LogicMonitor's Remote Workforce Executive Overview provides an example of the level of visibility LogicMonitor can provide across an enterprise organization; whether SaaS apps, VDI infrastructure, or critical networking, LogicMonitor can help.
Remote Workforce Visibility: SaaS
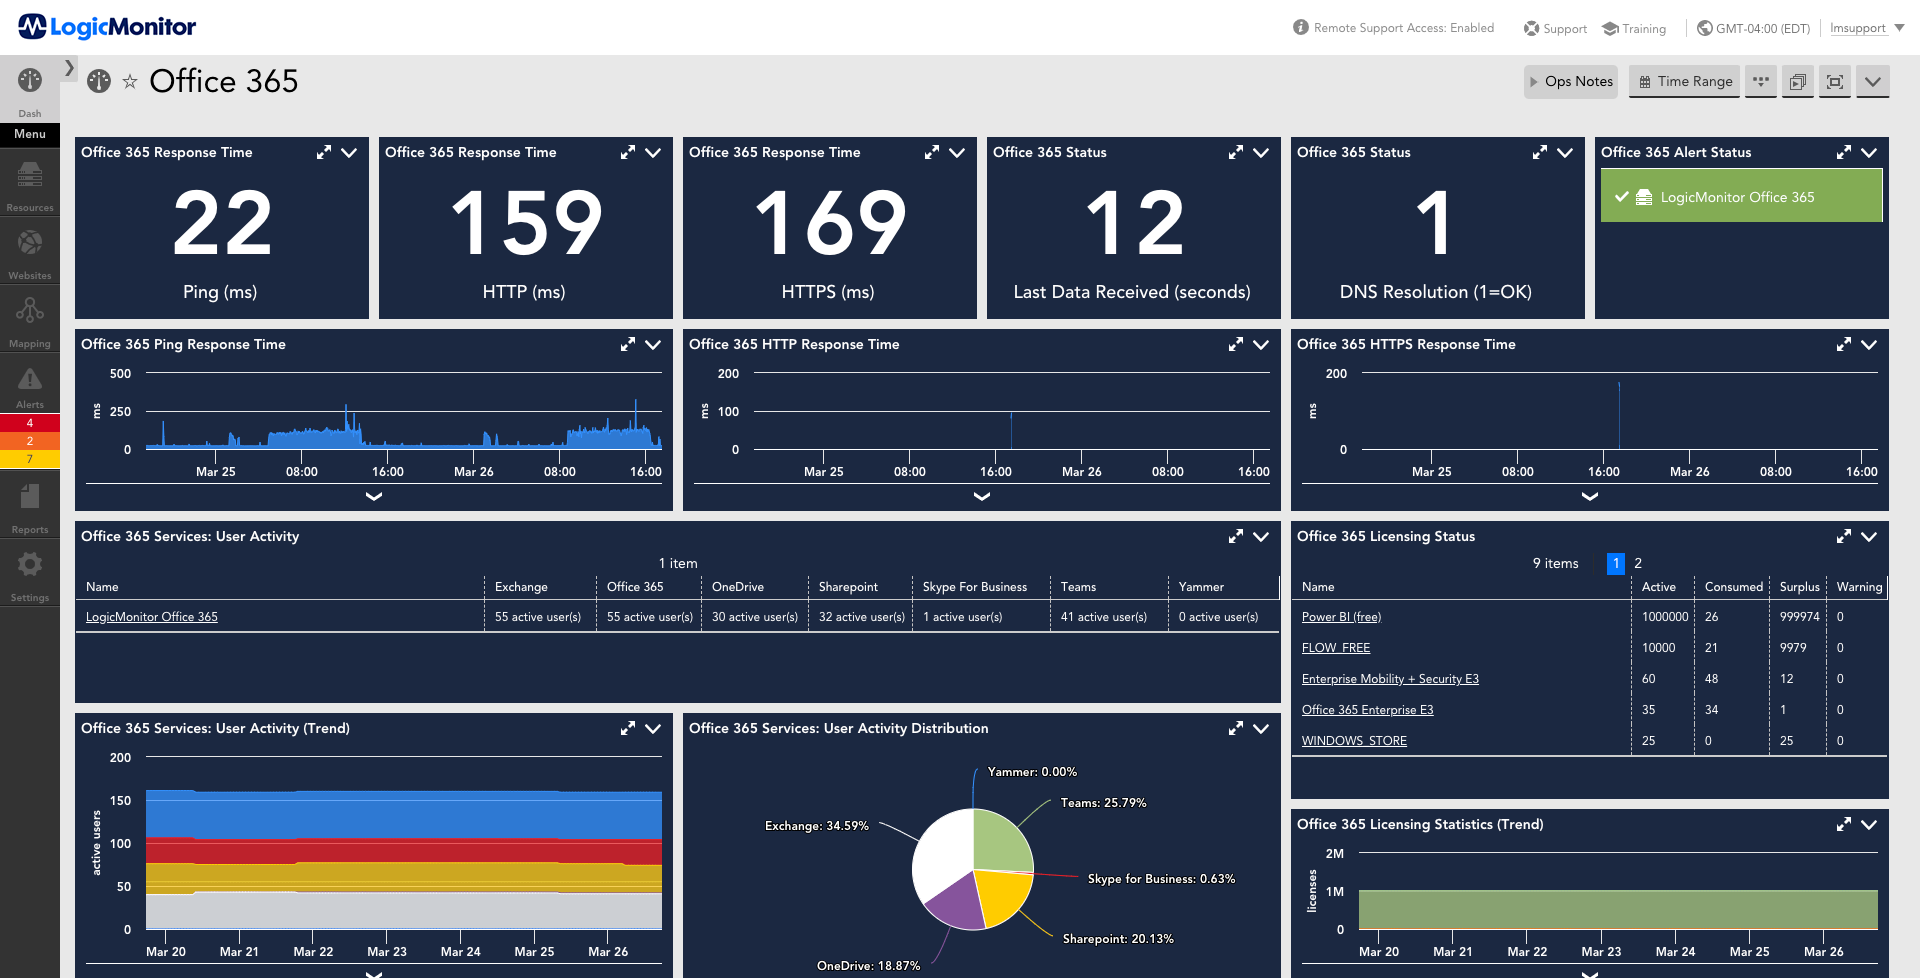
Office 365
Visibility into your Exchange Online, Outlook, OneDrive, SharePoint, Skype for Business, Teams, and Yammer environment to ensure that your users and customers remain productive.
Dashboard (GitHub)
Direct Download (JSON)
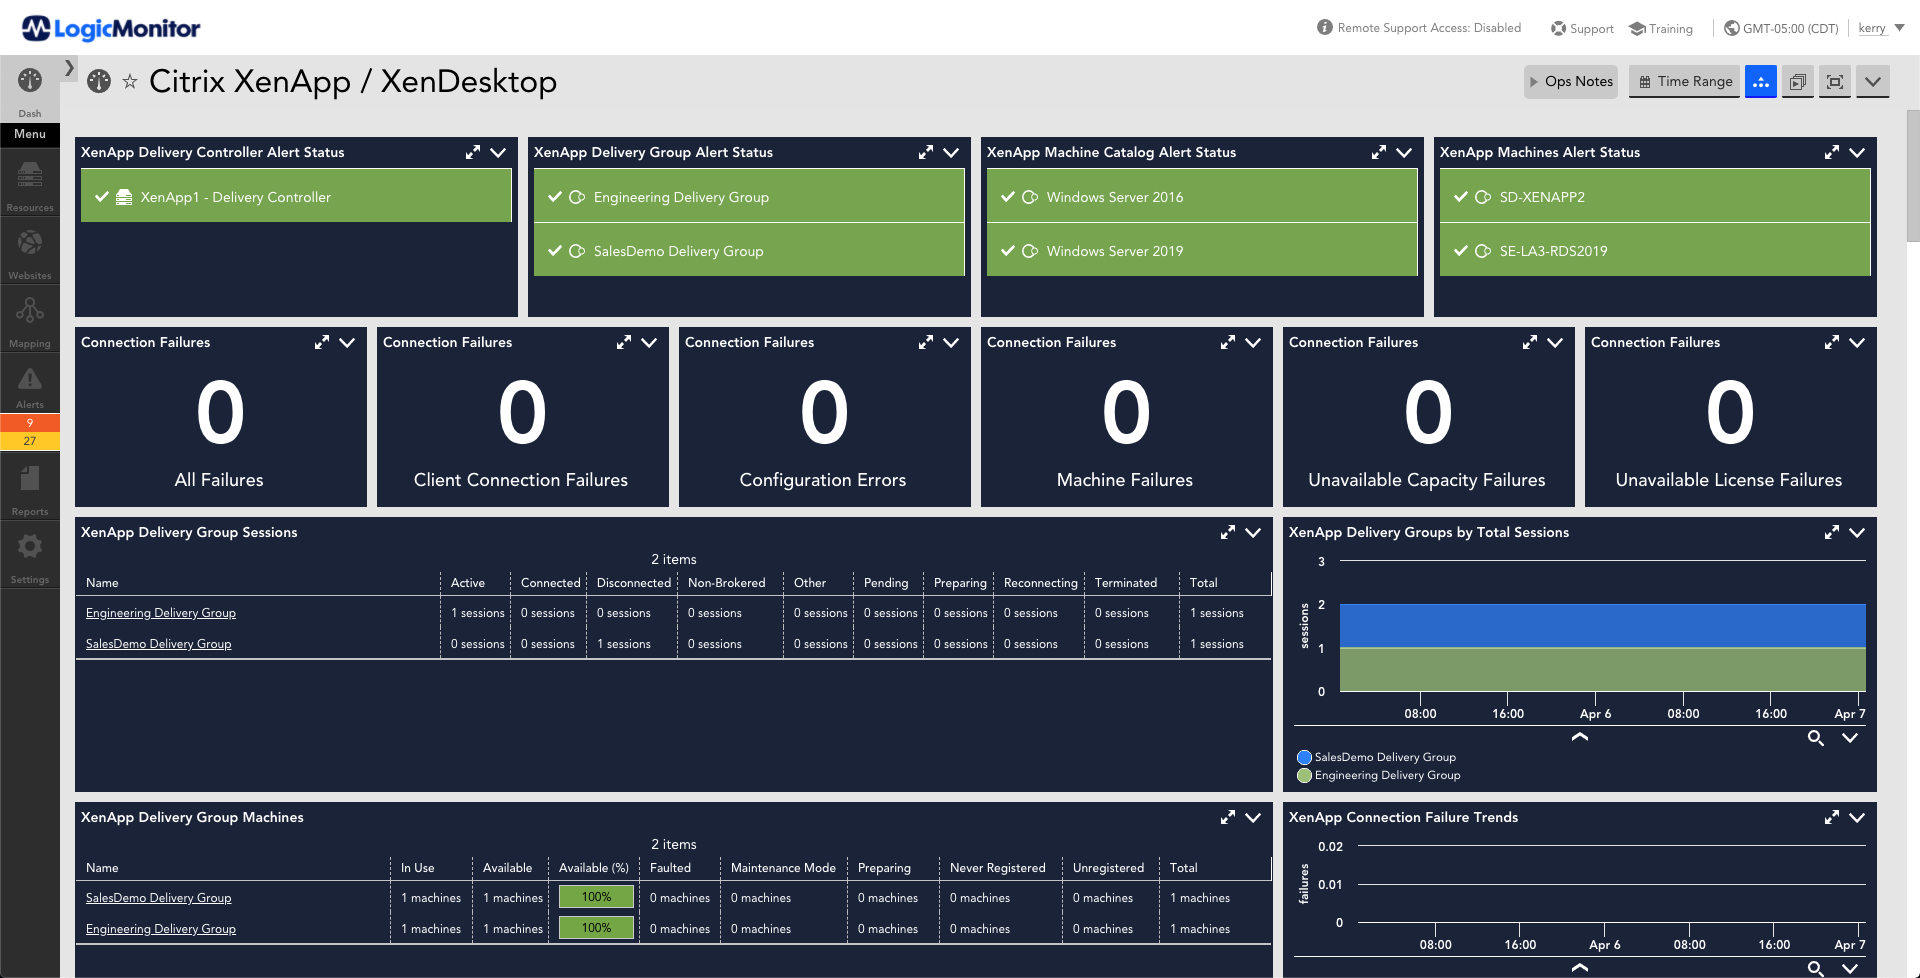
Remote Workforce Visibility: Virtual / Remote Desktop(s)
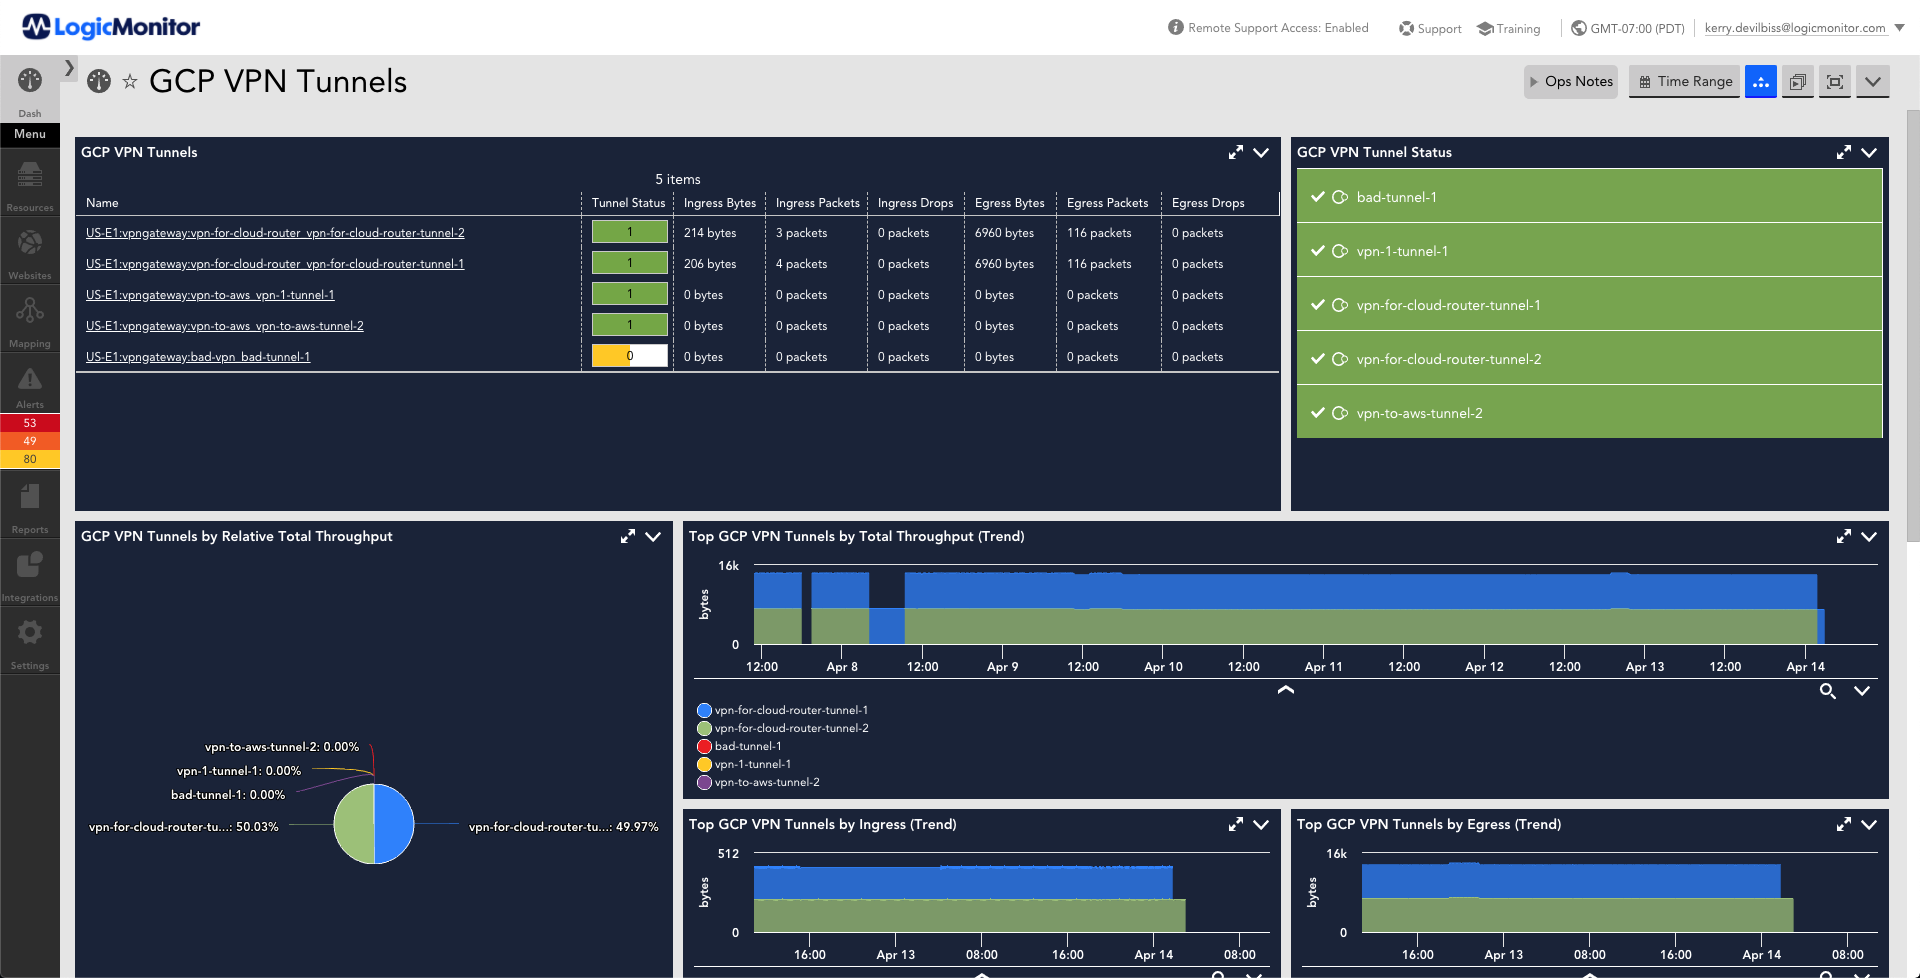
Remote Workforce Visibility: Networking / VPN
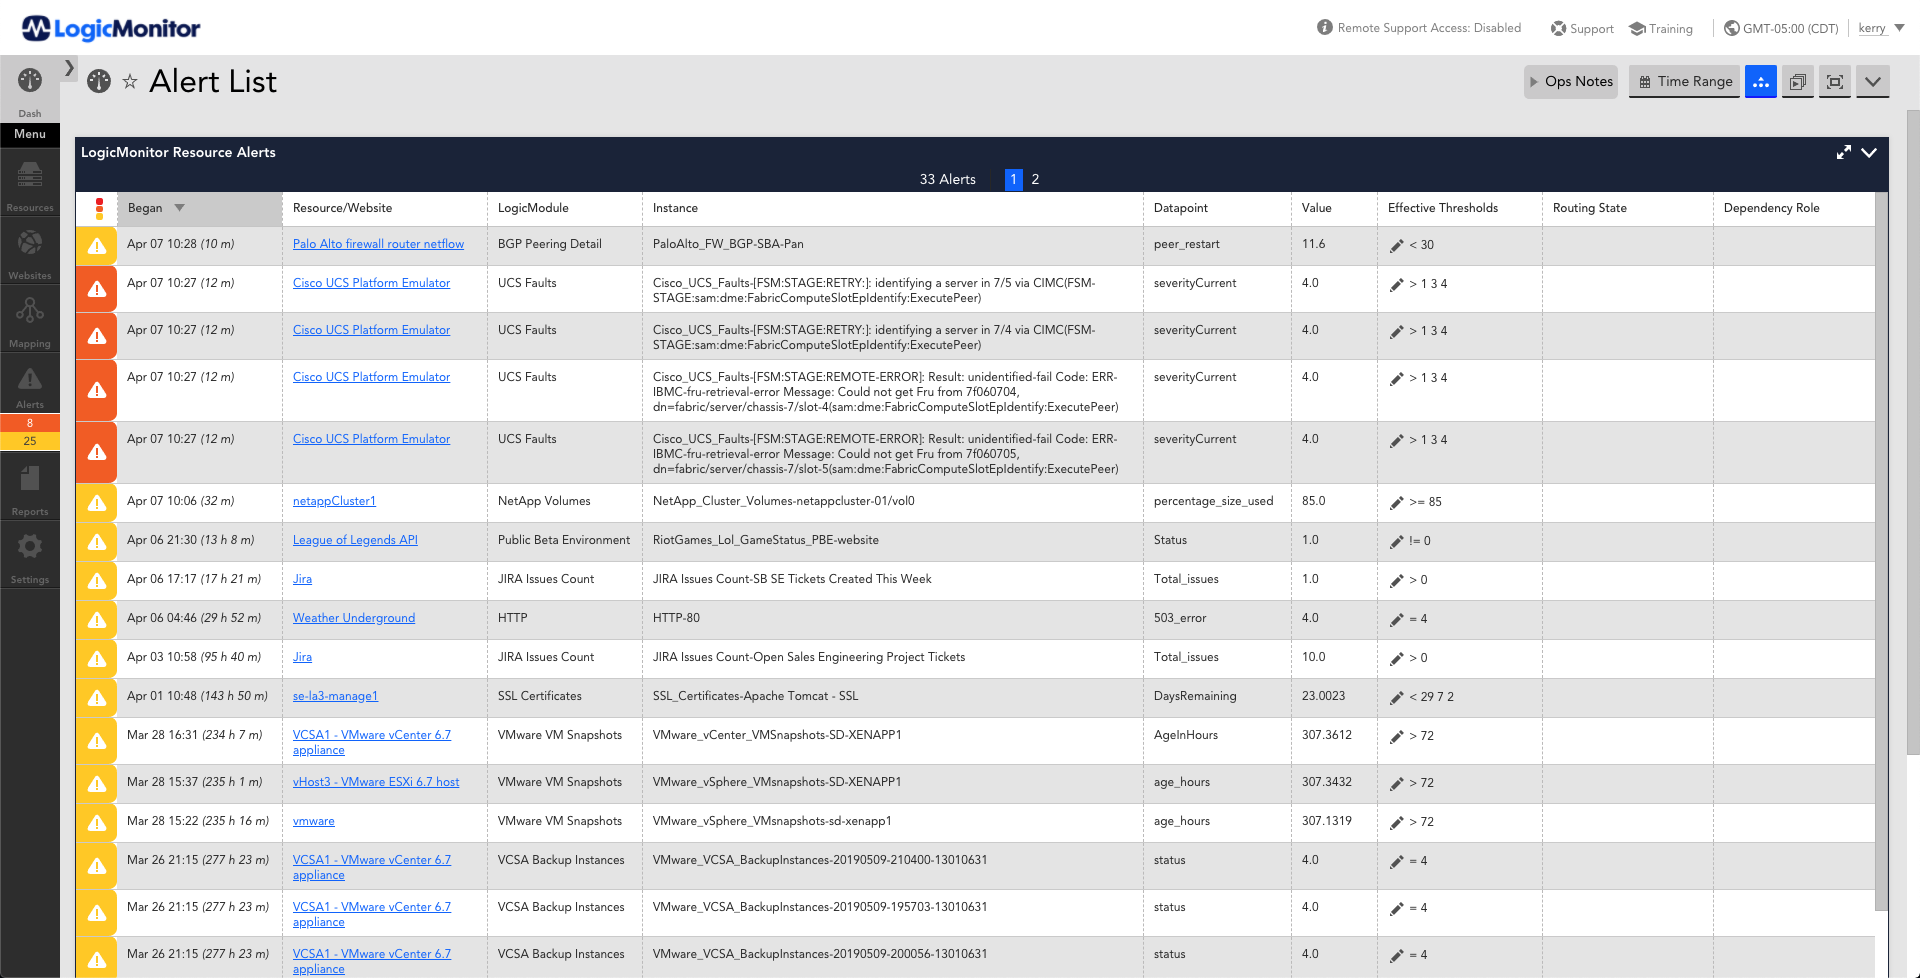
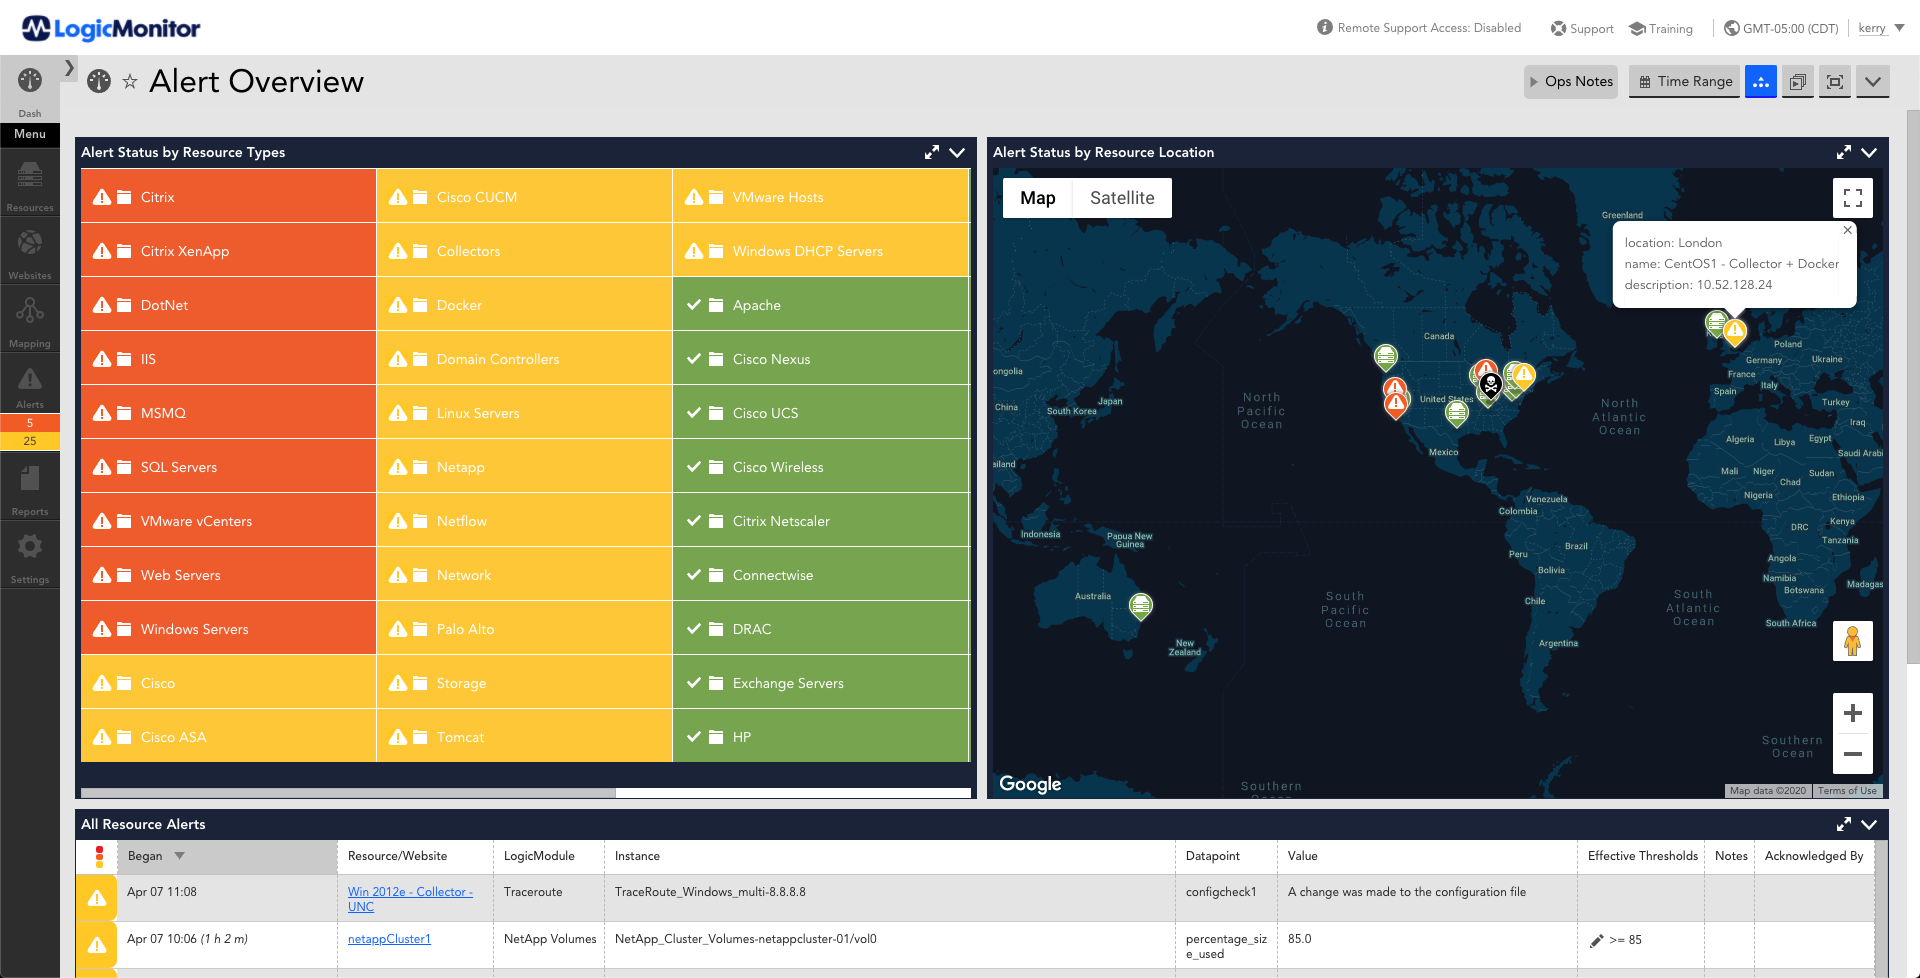
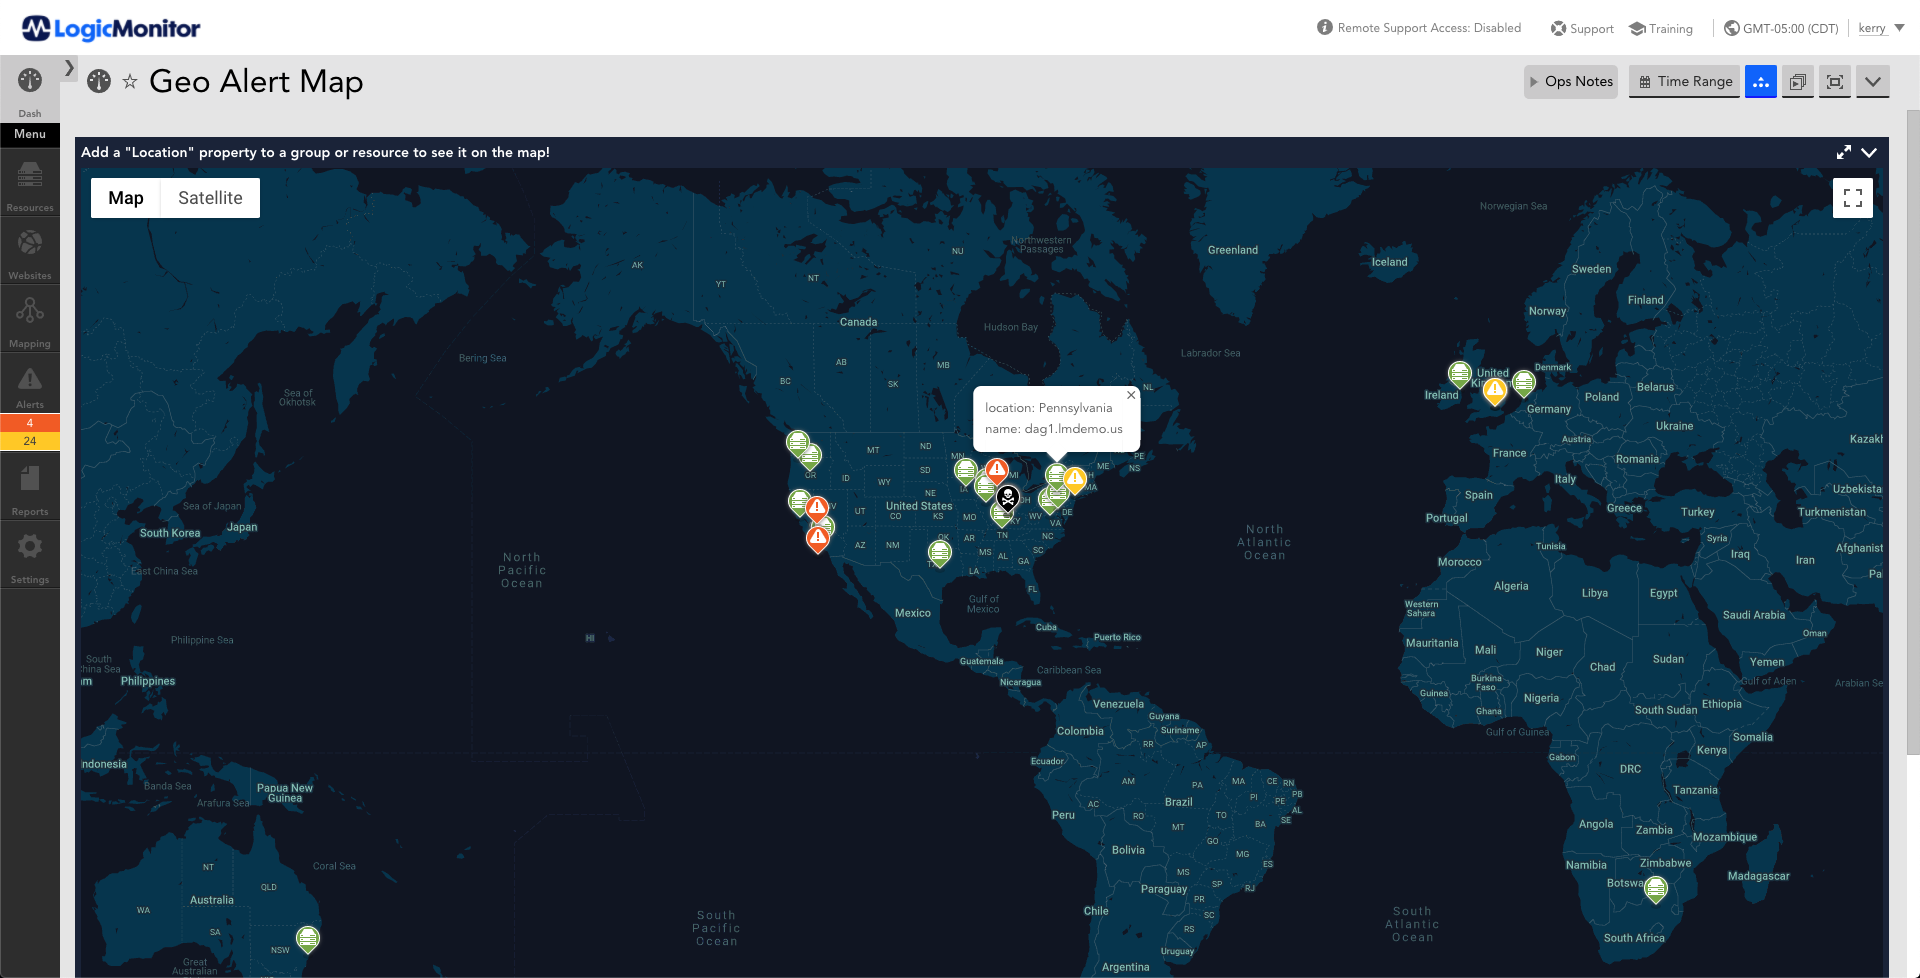
Alerting
View all Alerting Dashboards on GitHub
Applications
View all Application Dashboards on GitHub
Office 365
Visibility into your Exchange Online, Outlook, OneDrive, SharePoint, Skype for Business, Teams, and Yammer environment to ensure that your users and customers remain productive.
Dashboard (GitHub)
Direct Download (JSON)
Cloud
LM Cloud allows you to comprehensively monitor your cloud services in LogicMonitor alongside your existing monitored infrastructure, giving you an end-to-end view of your entire hybrid infrastructure performance.
Amazon Web Services (AWS)
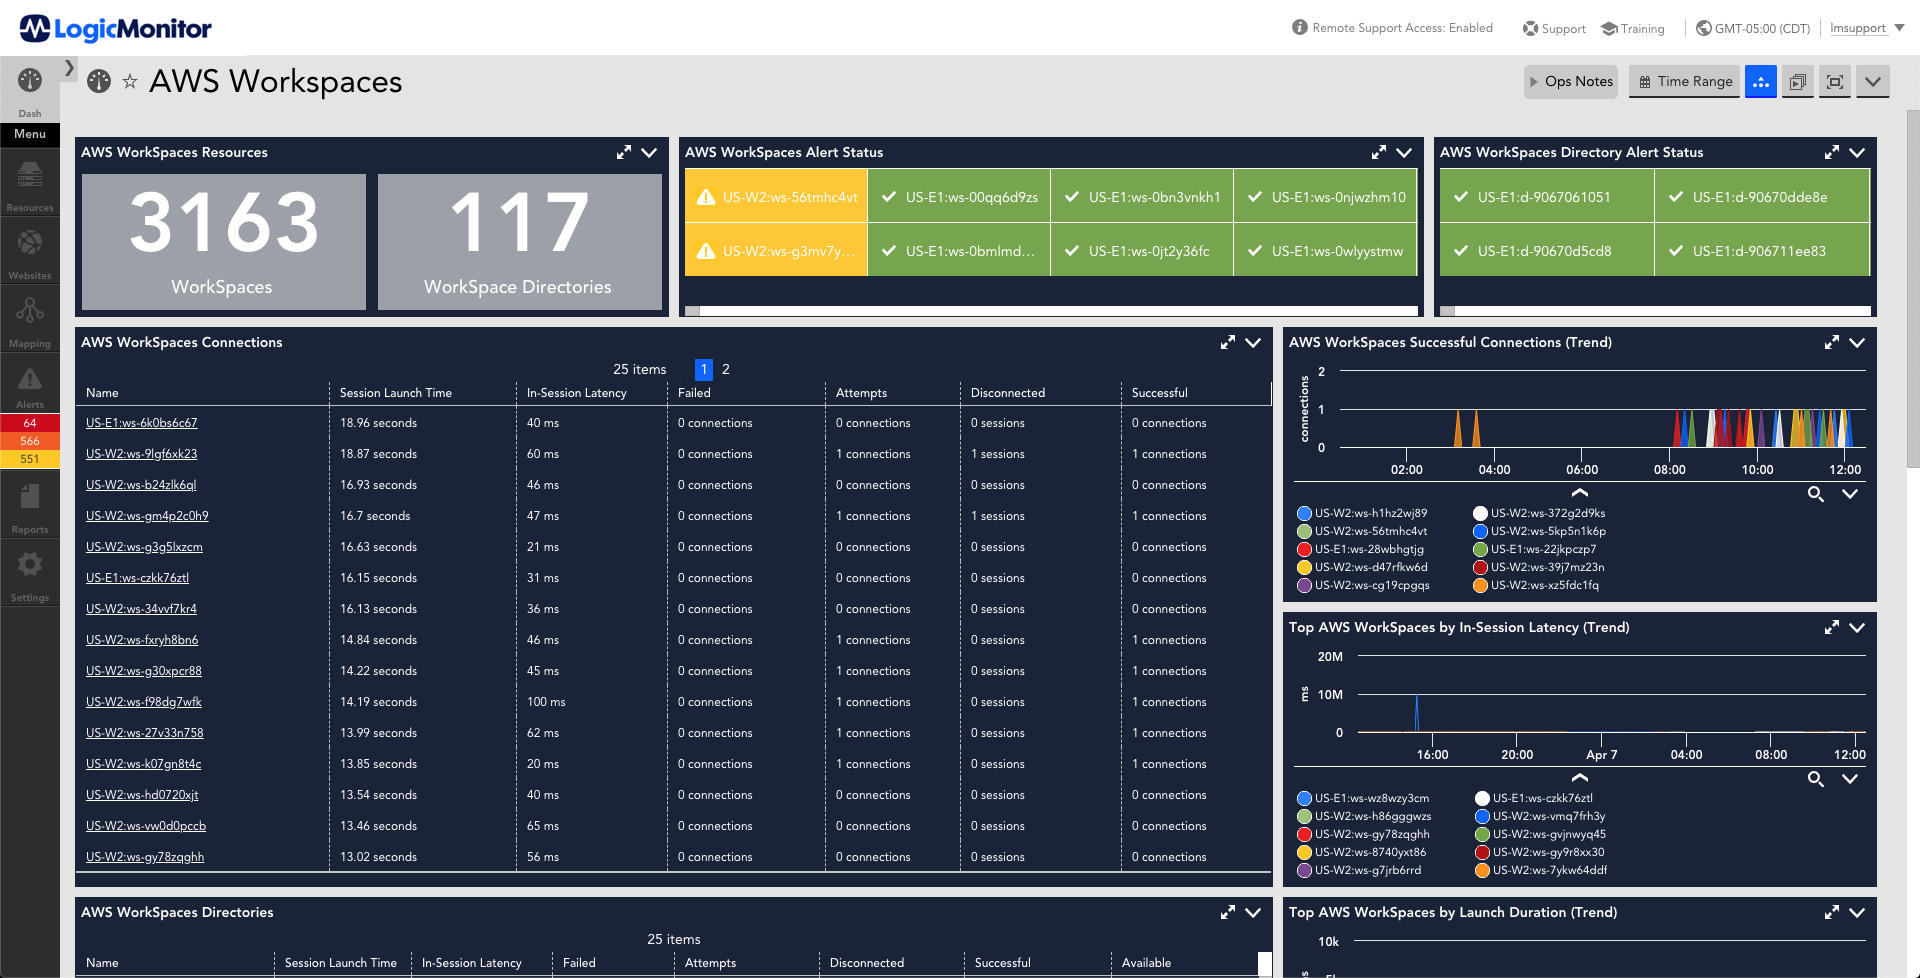
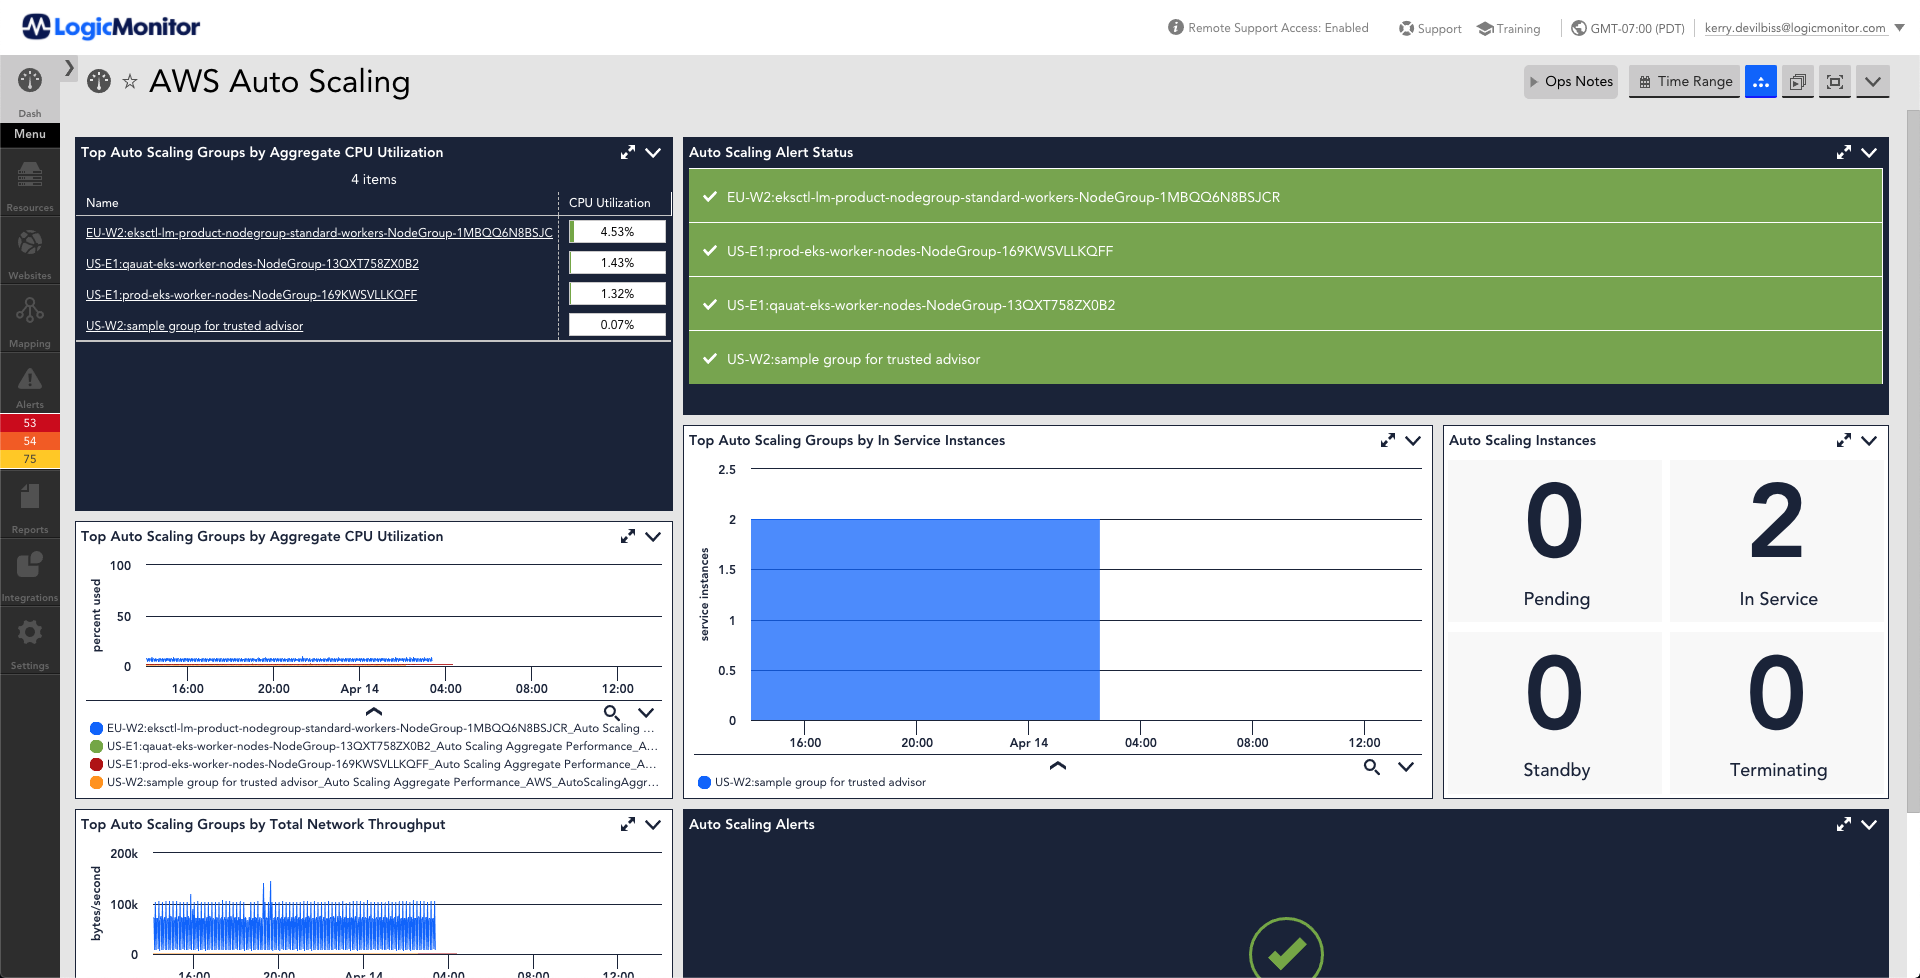
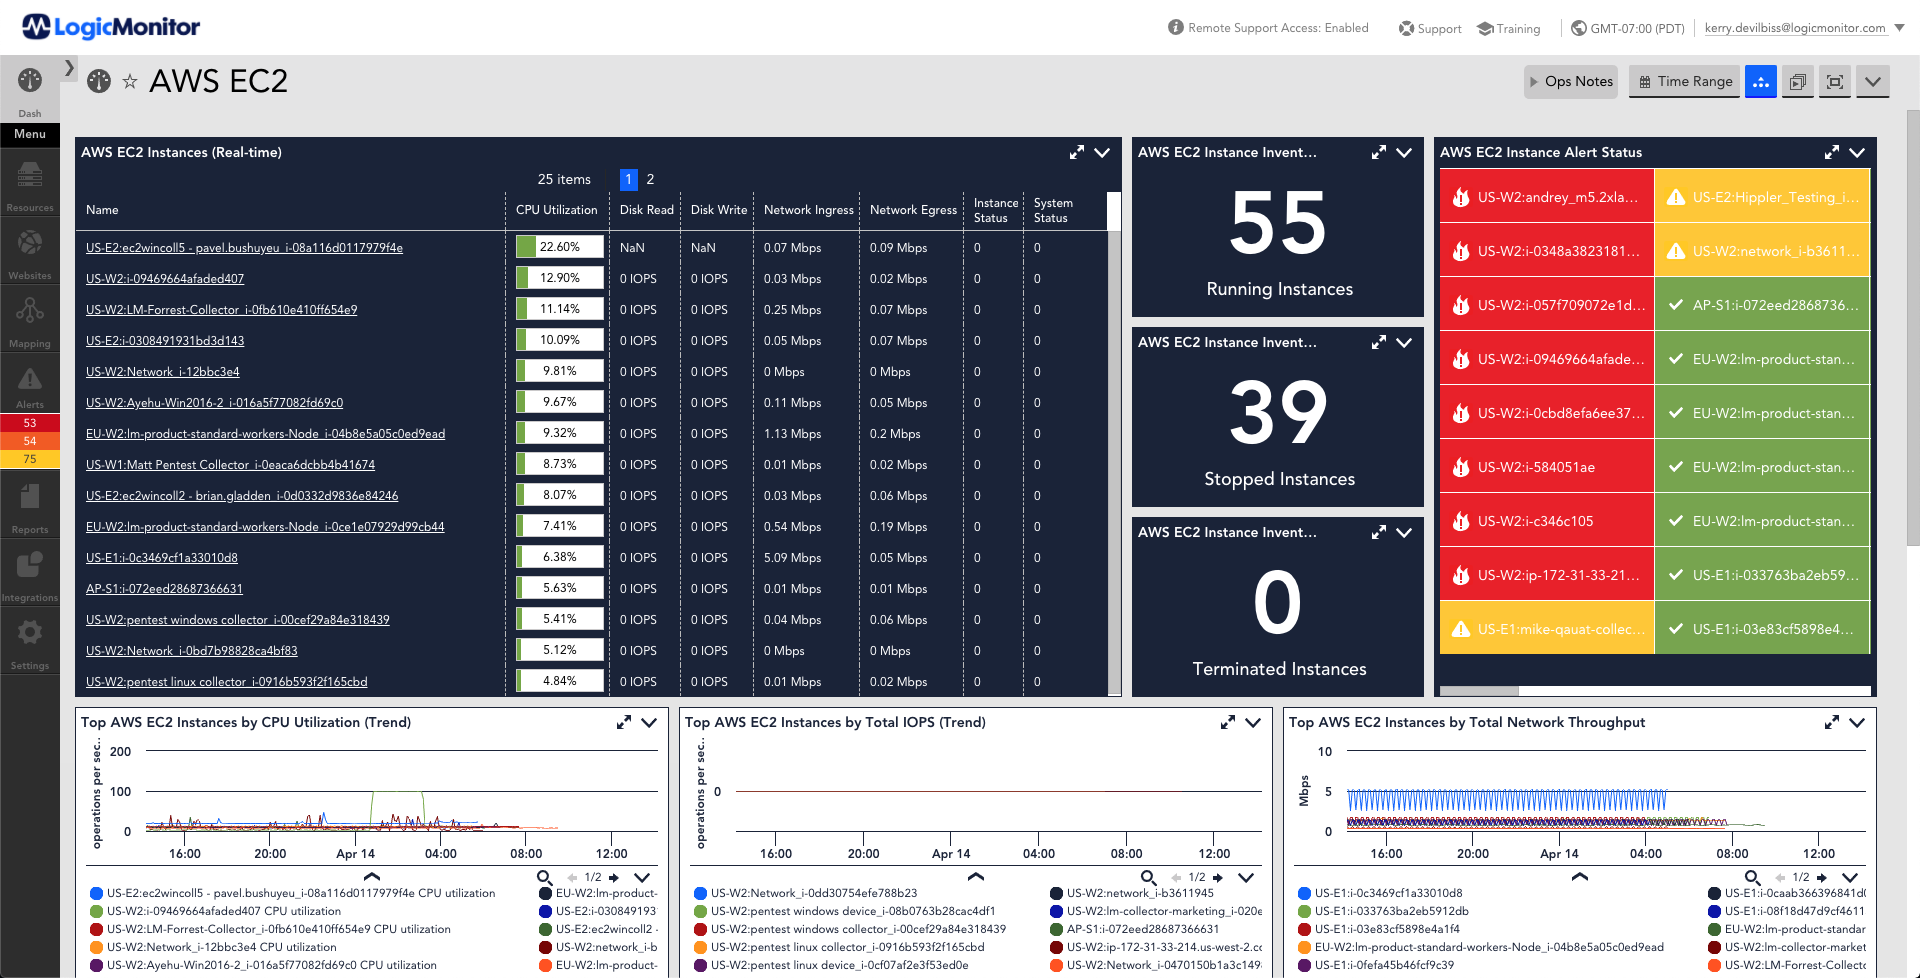
Comprehensive visibility into AWS infrastructure health and performance that can be otherwise challenging to obtain.
View all AWS Dashboards on GitHub
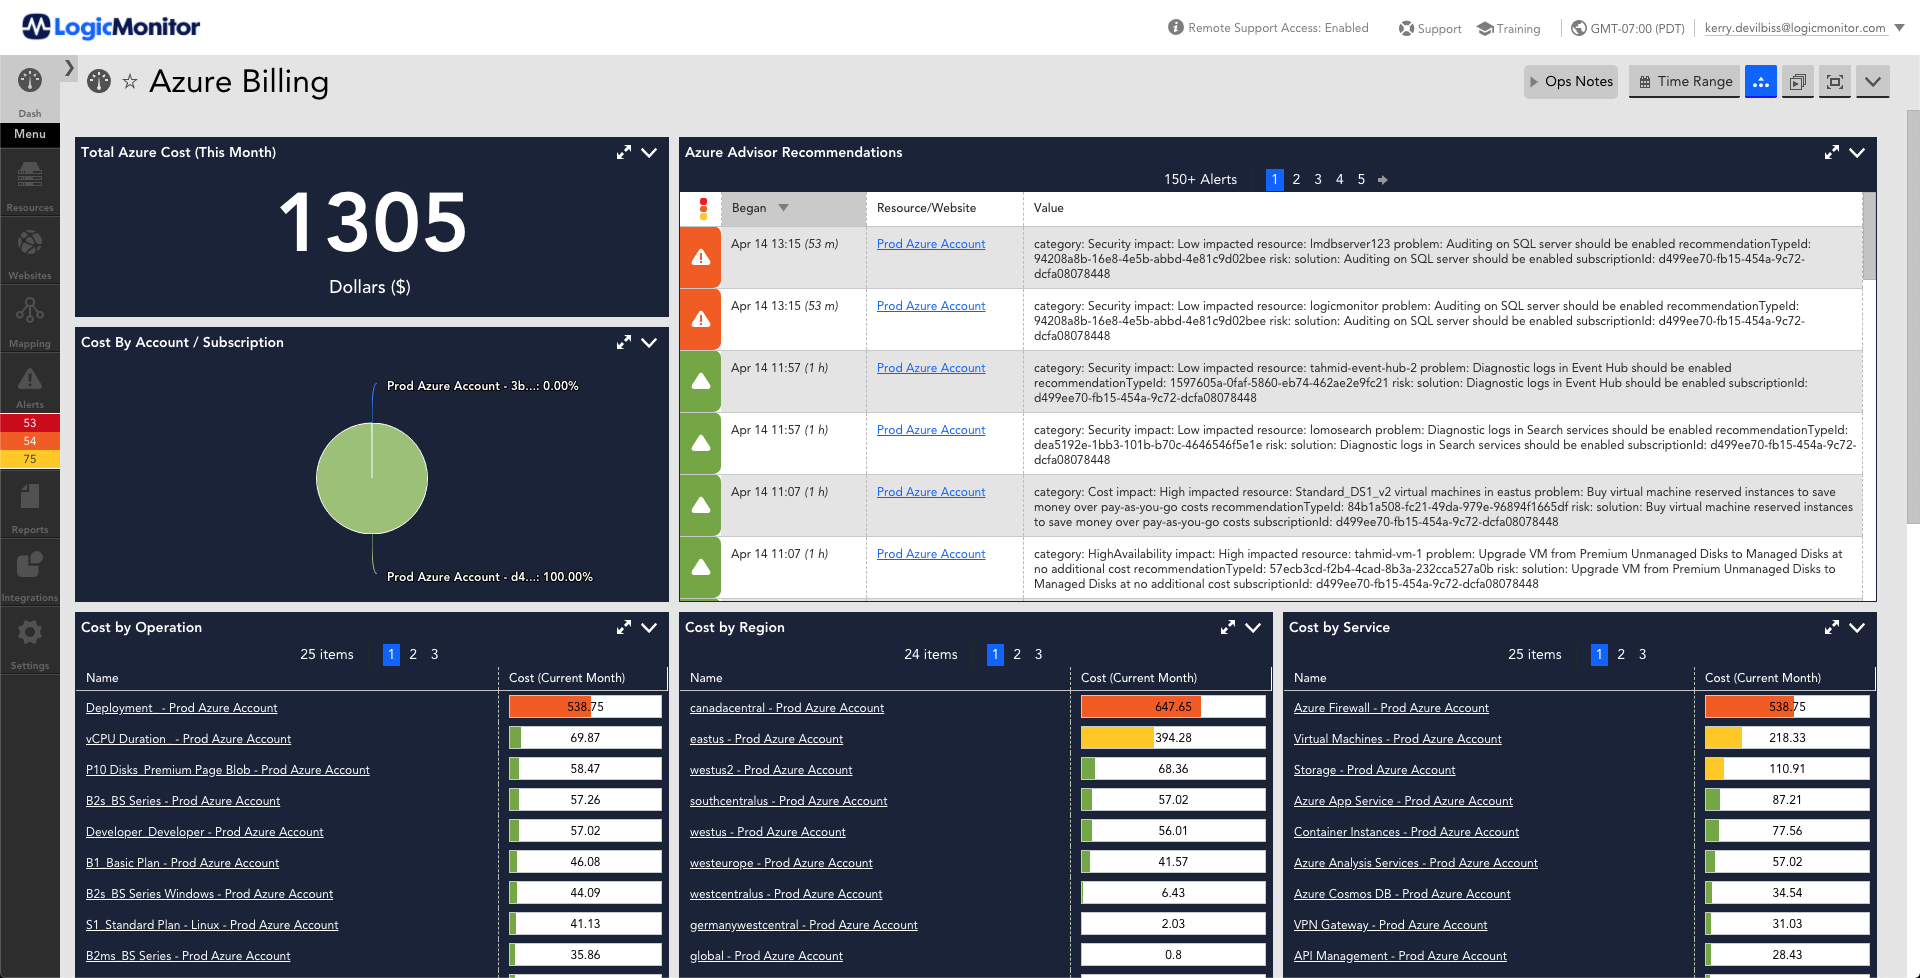
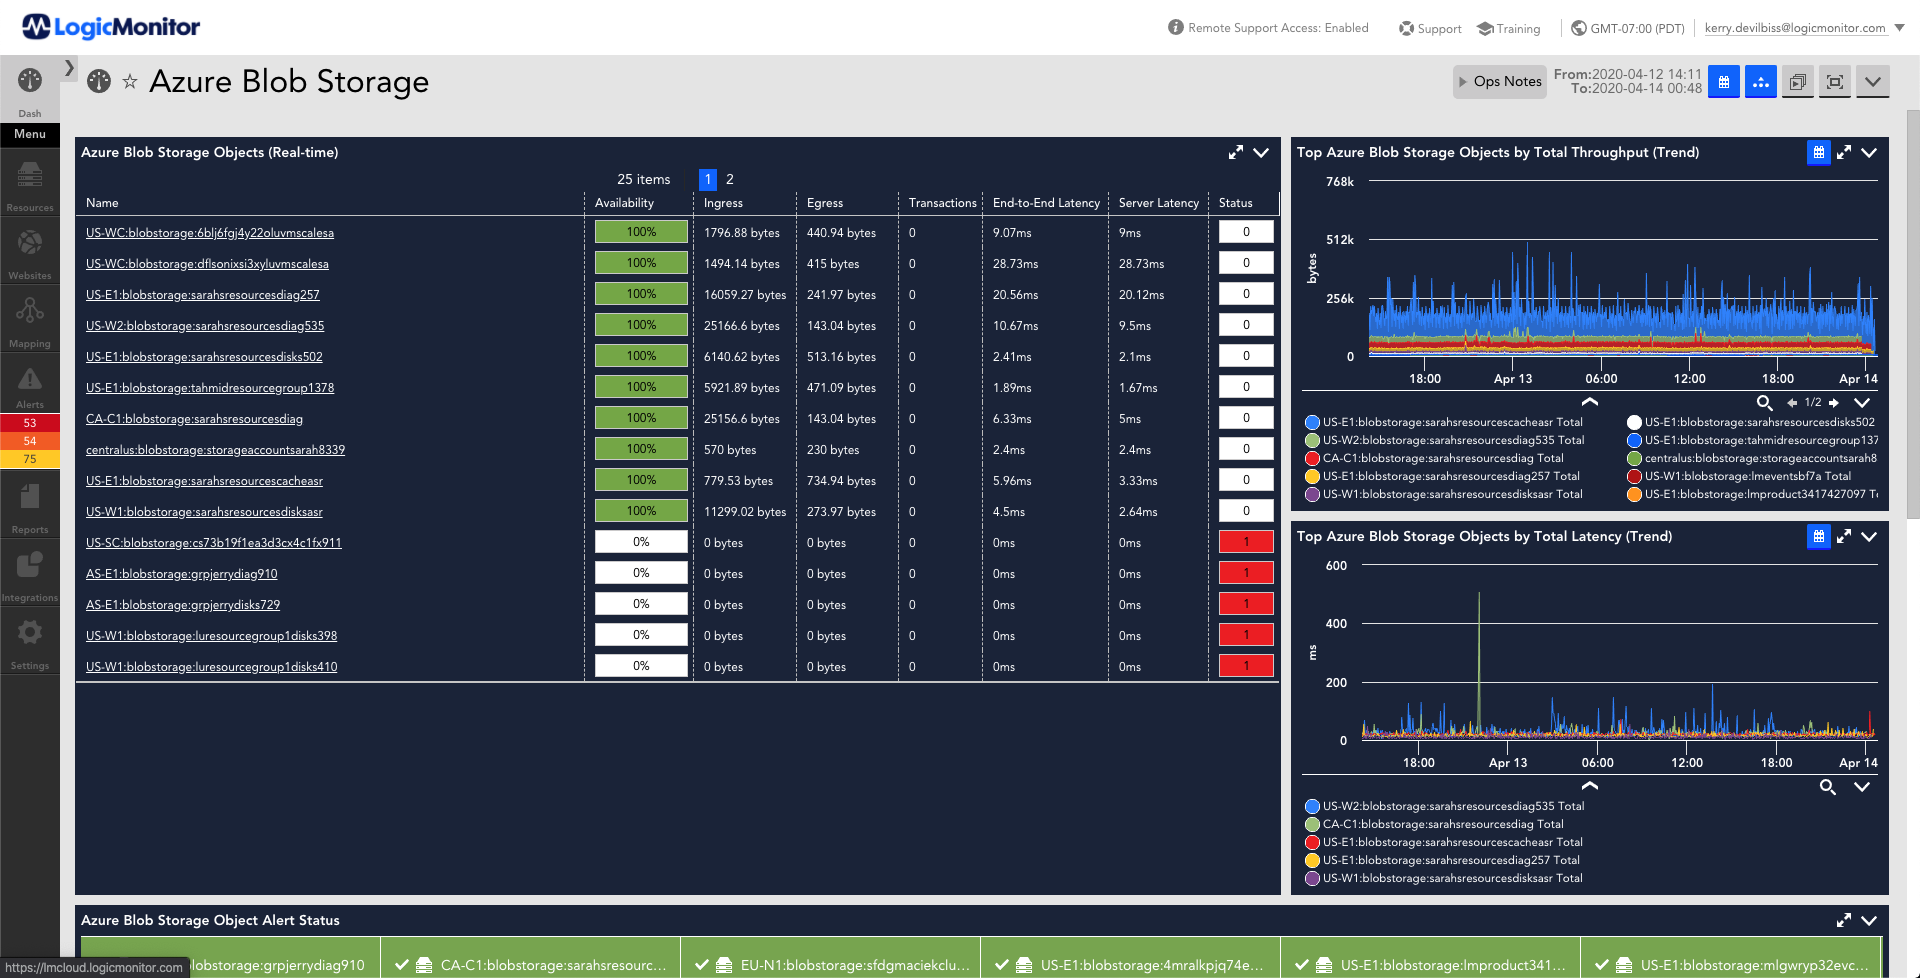
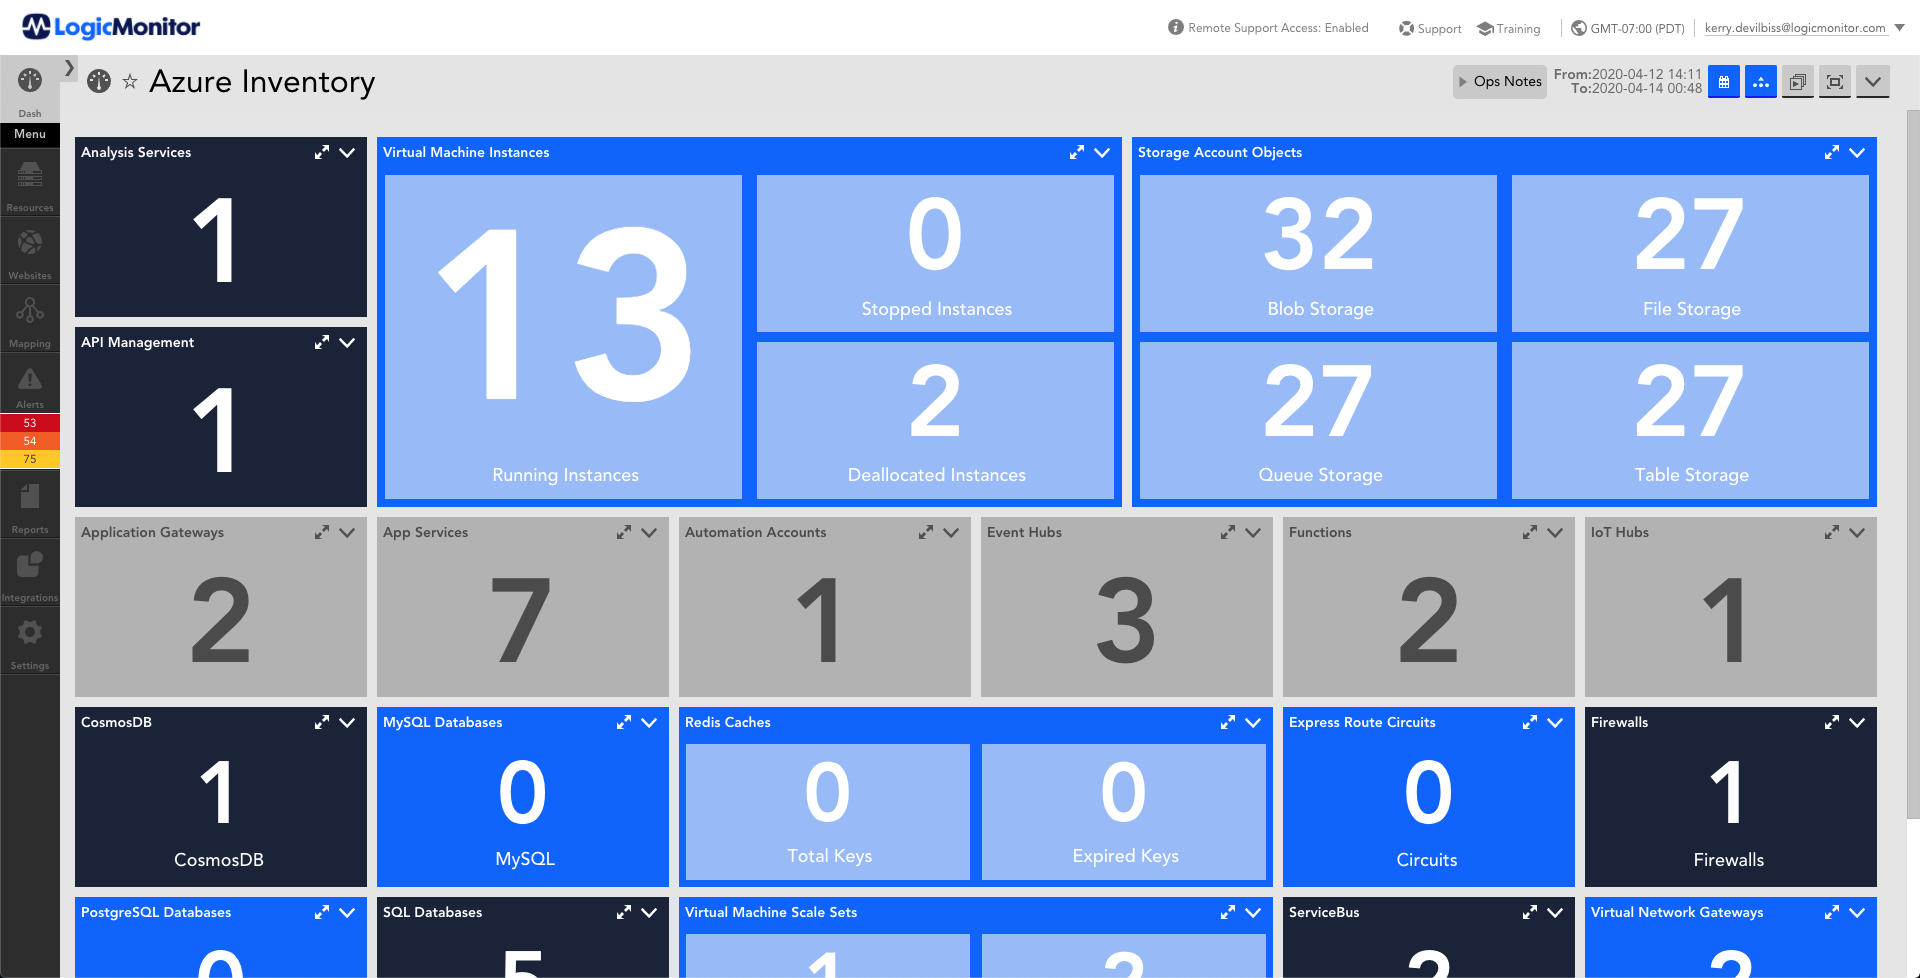
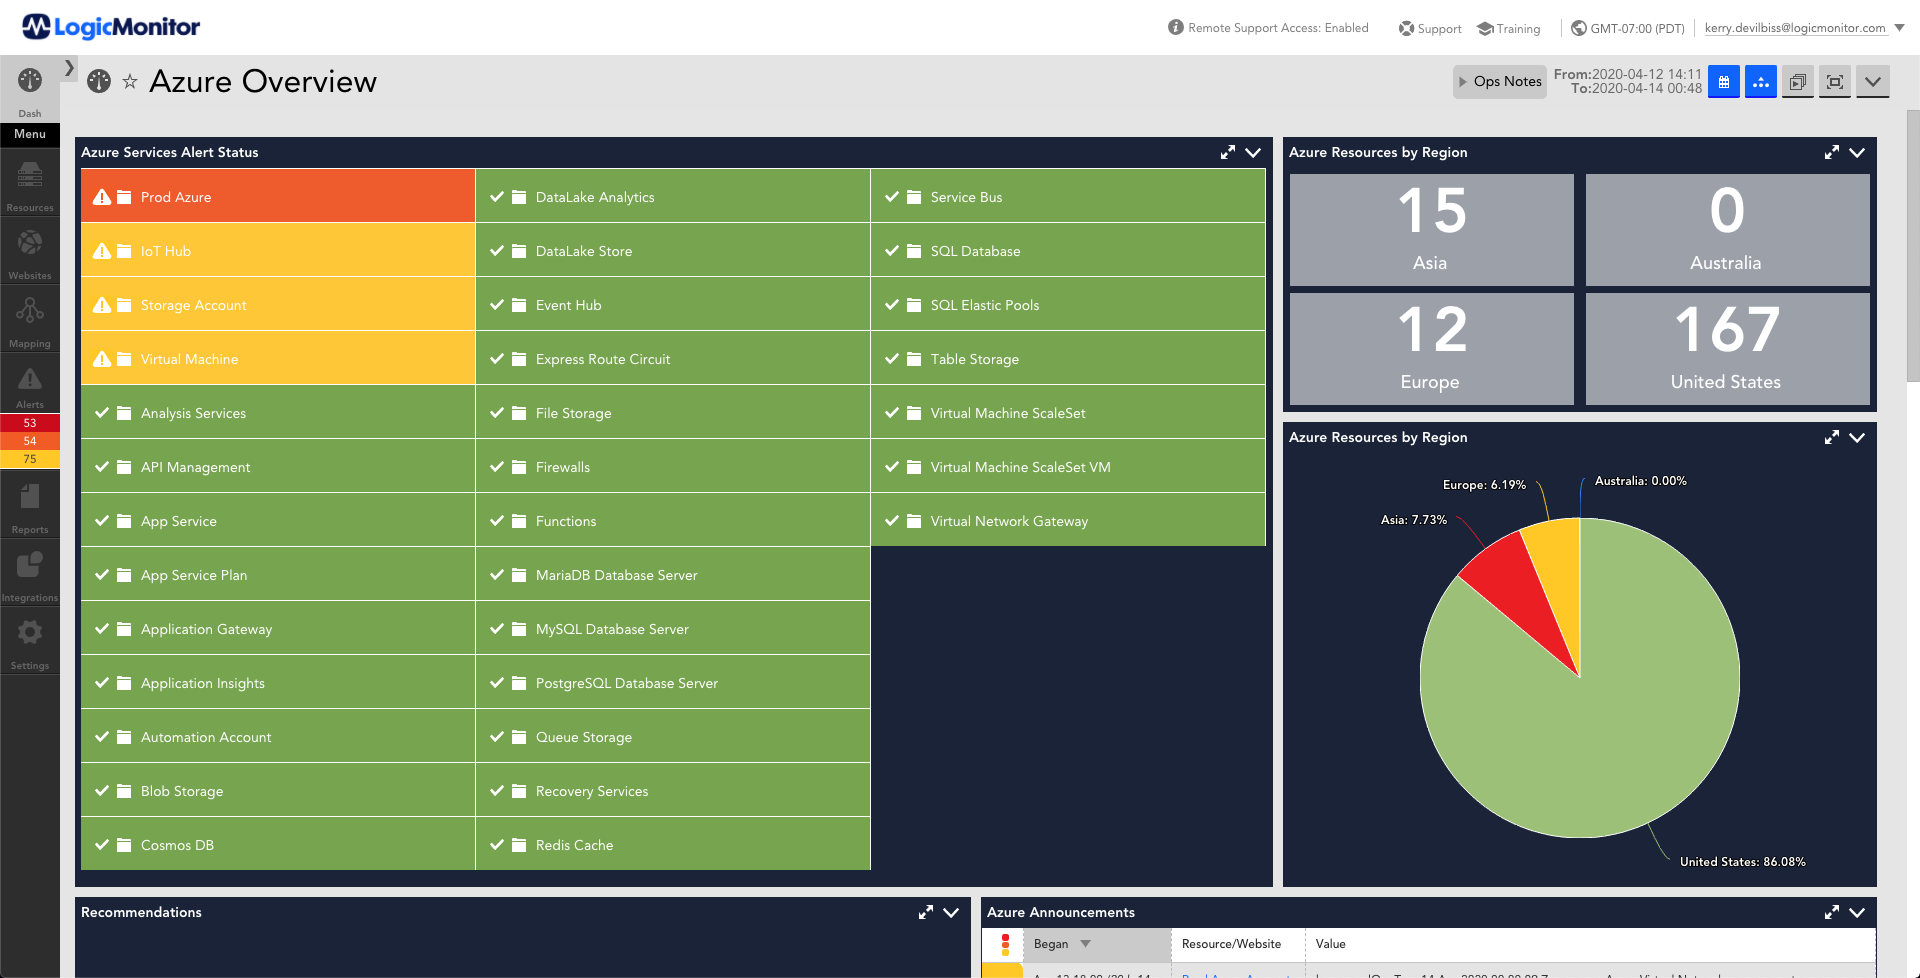
Microsoft Azure
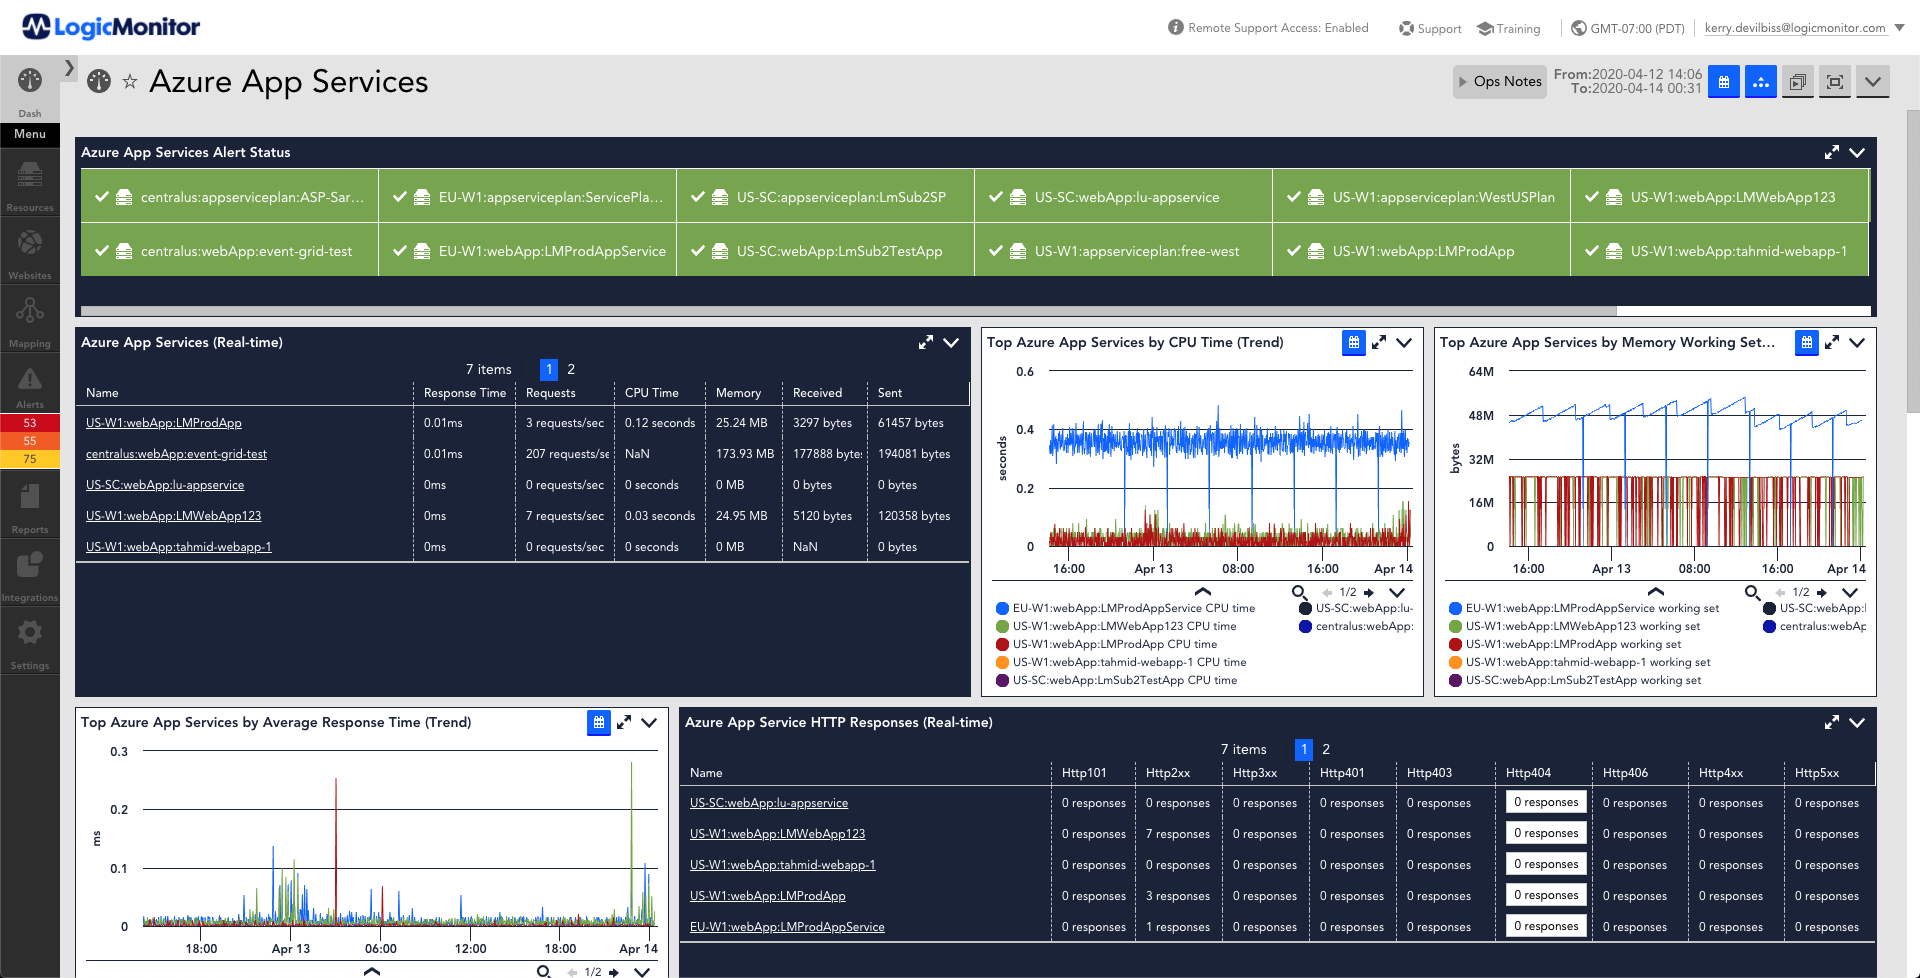
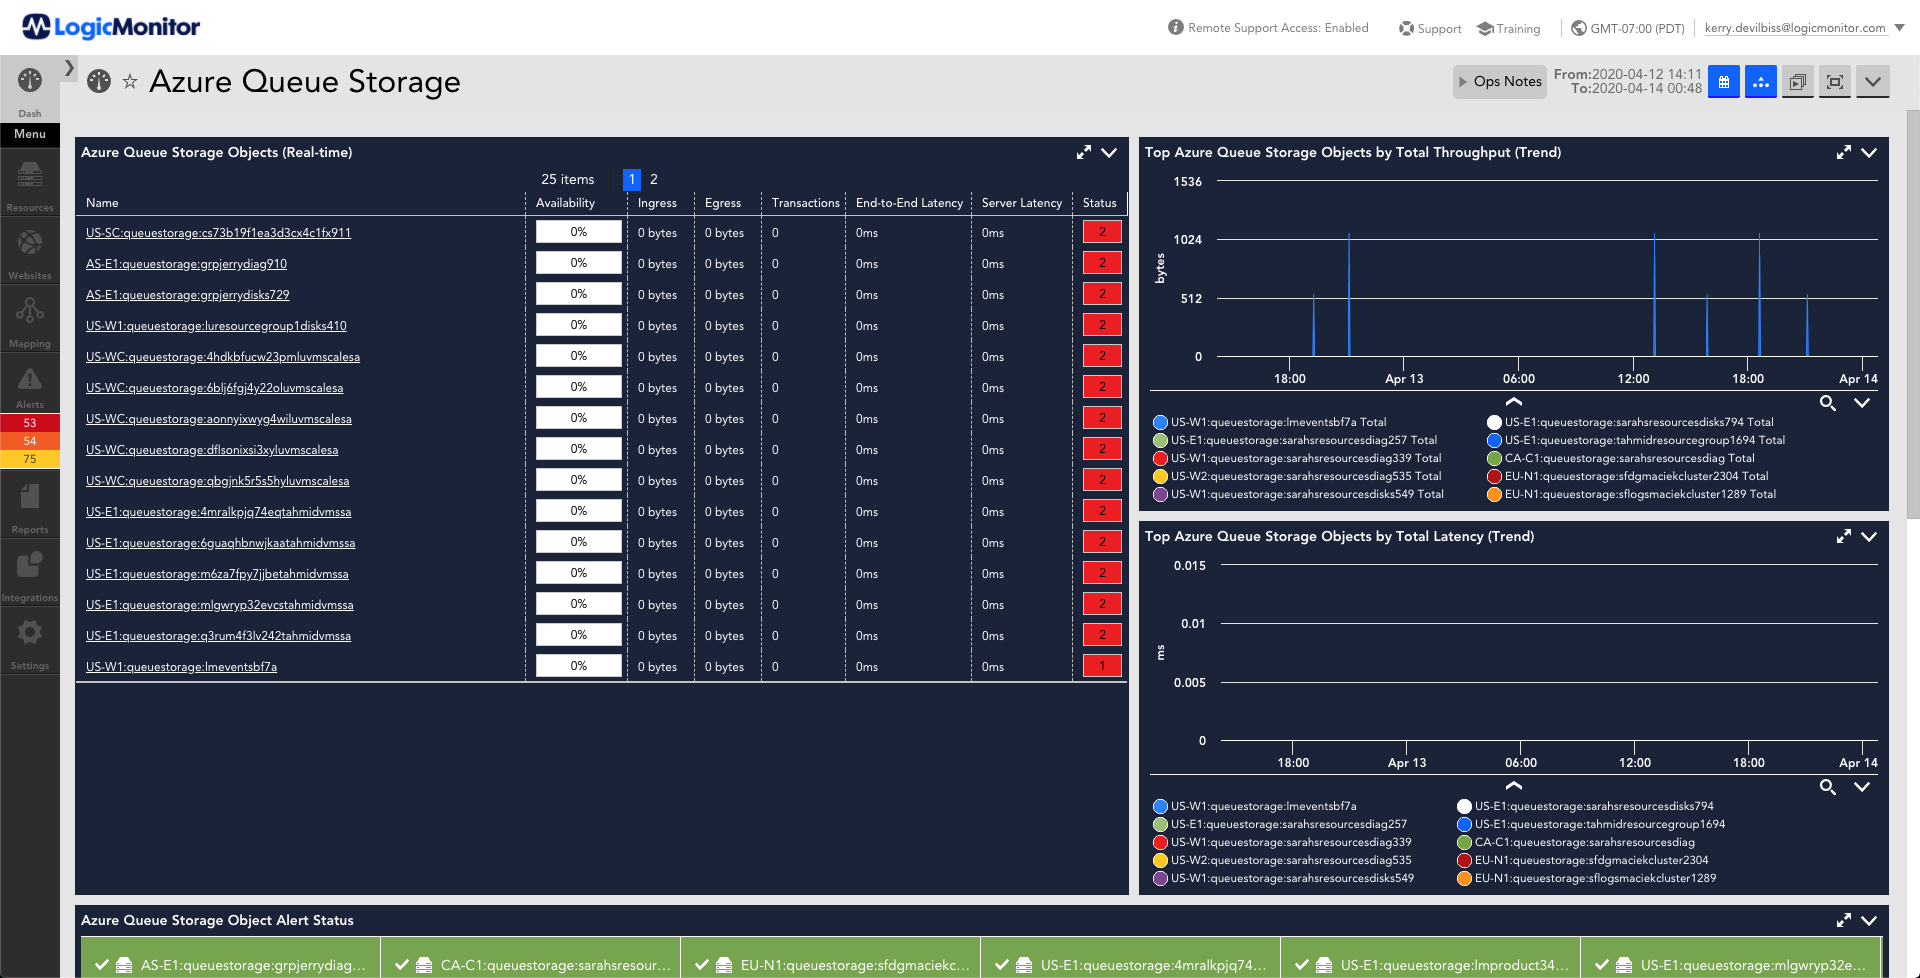
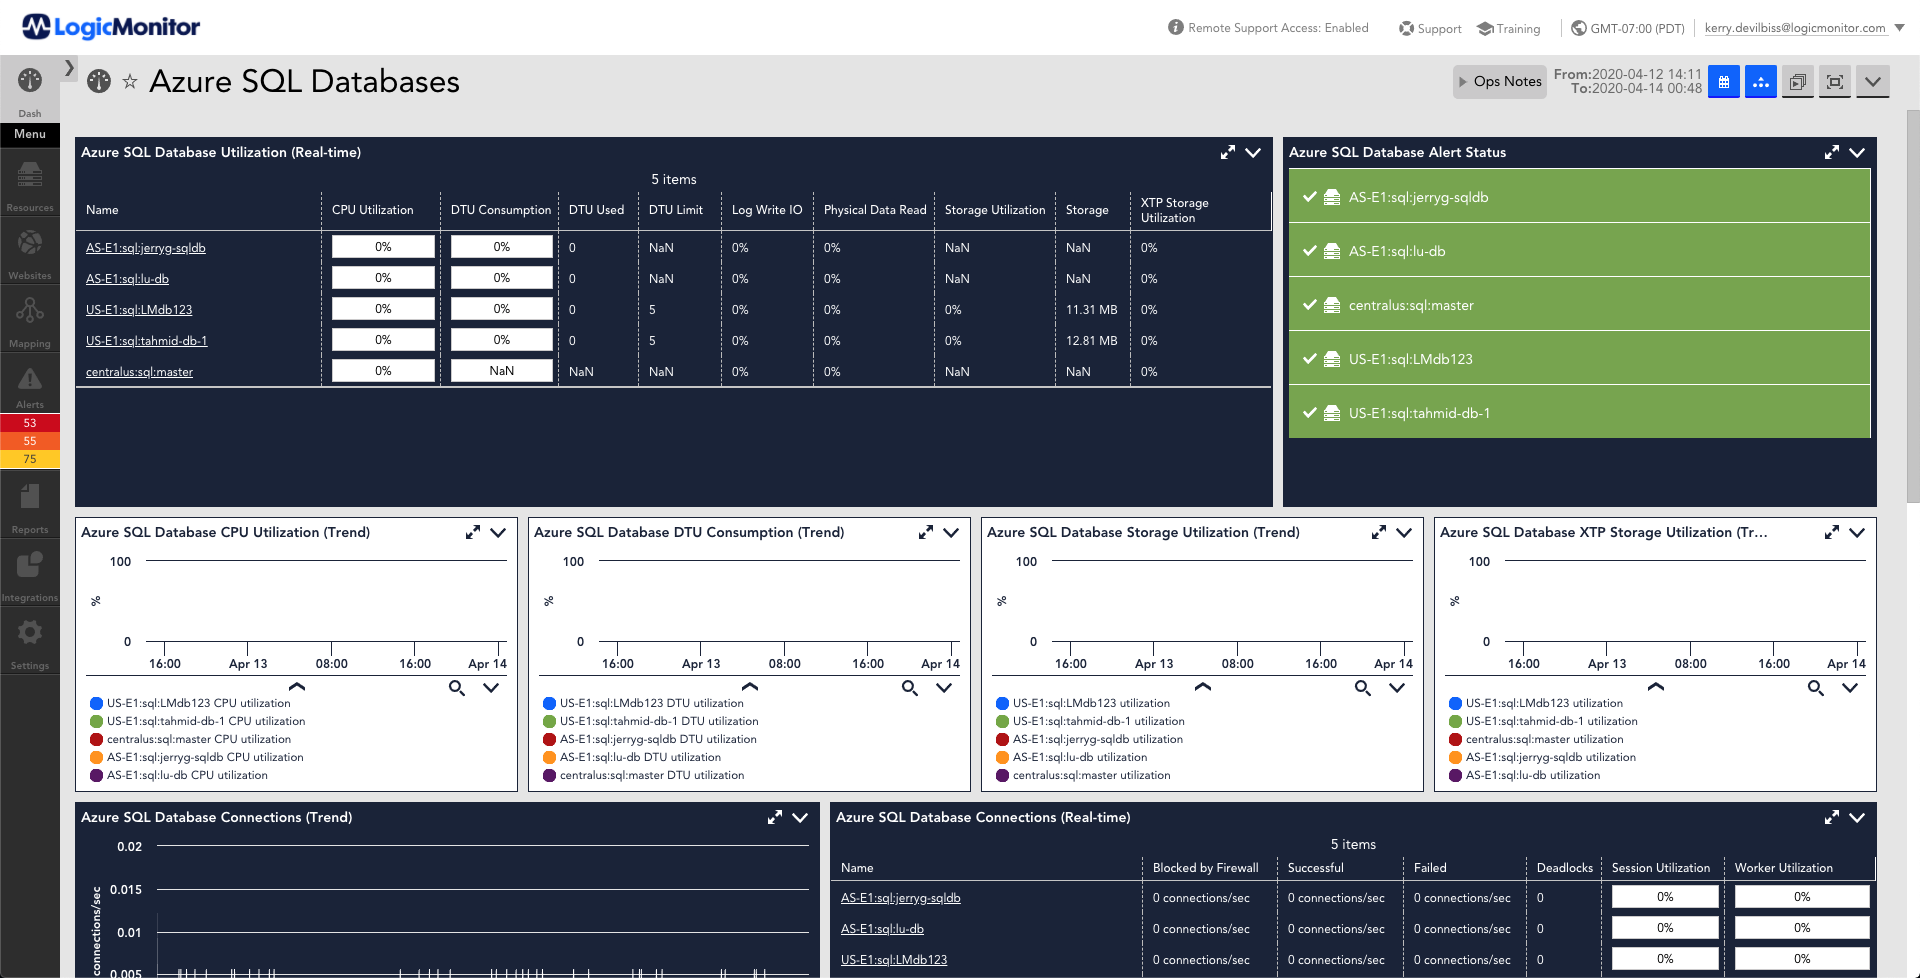
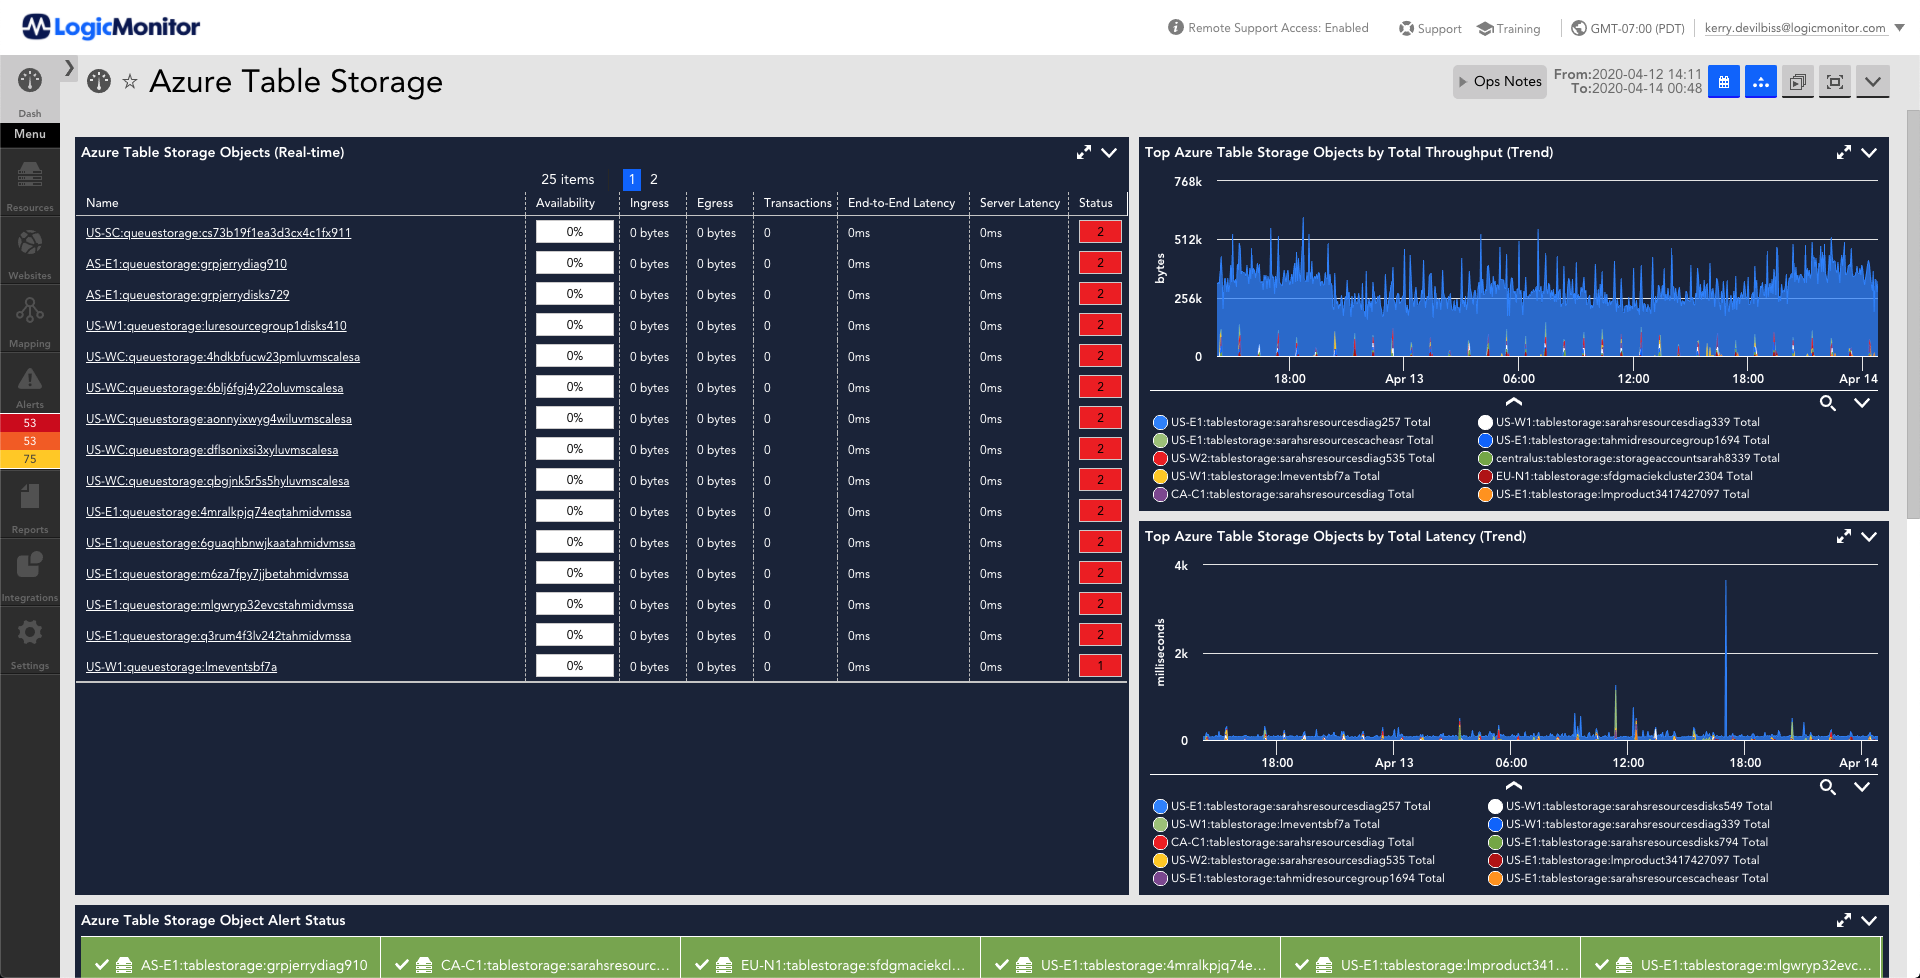
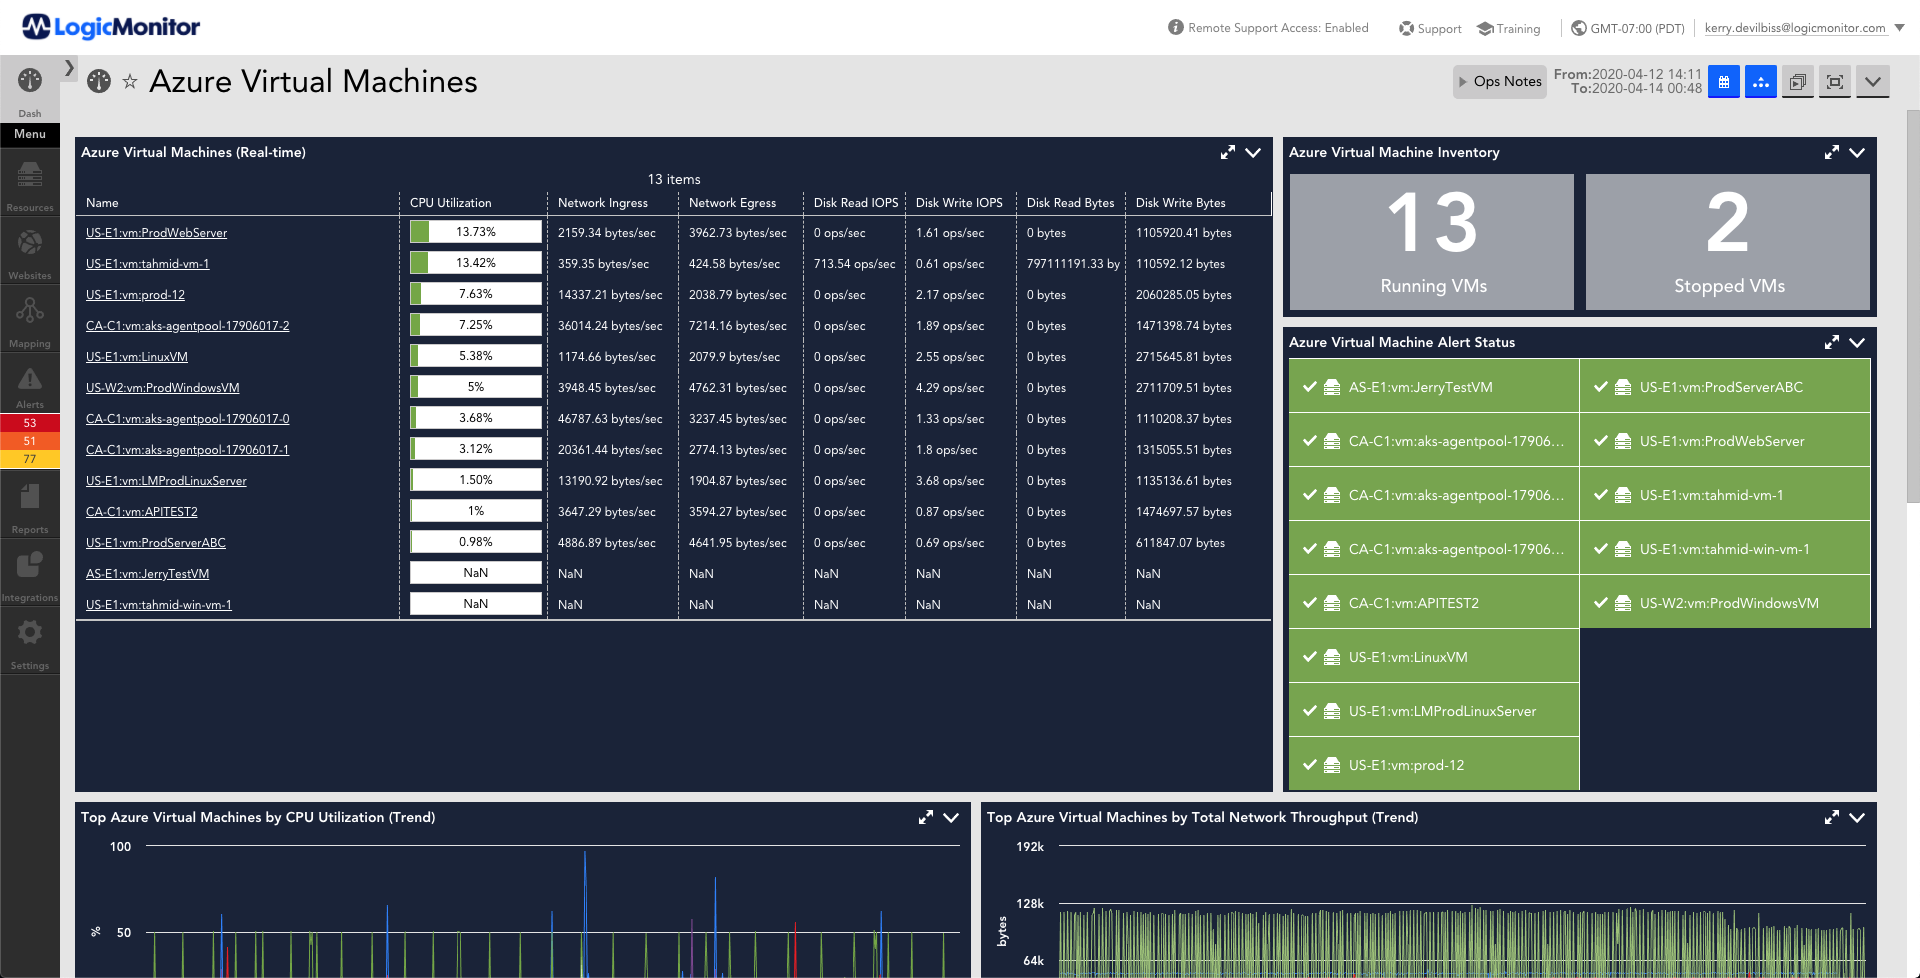
LogicMonitor's Azure monitoring seamlessly integrates with dashboards, alerting, reporting, and forecasting functionalities so that you can visualize the data for your entire hybrid infrastructure.
View all Azure Dashboards on GitHub
Google Cloud Platform (GCP)
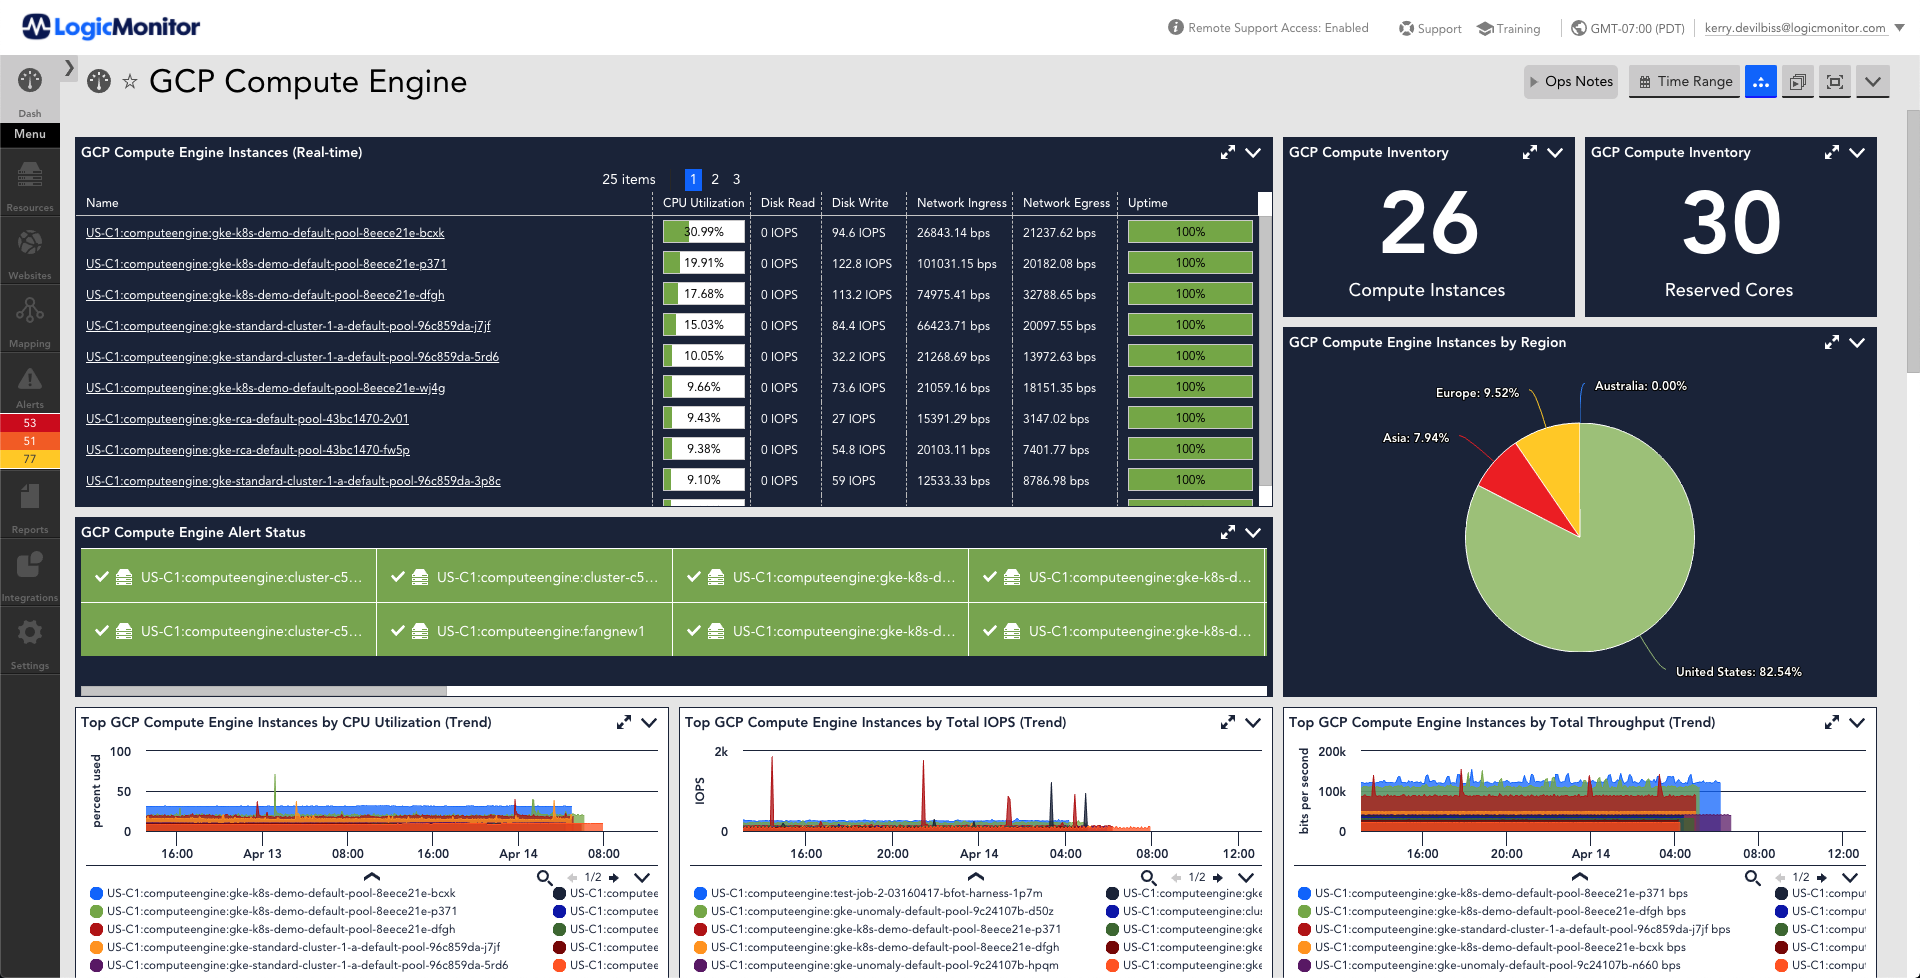
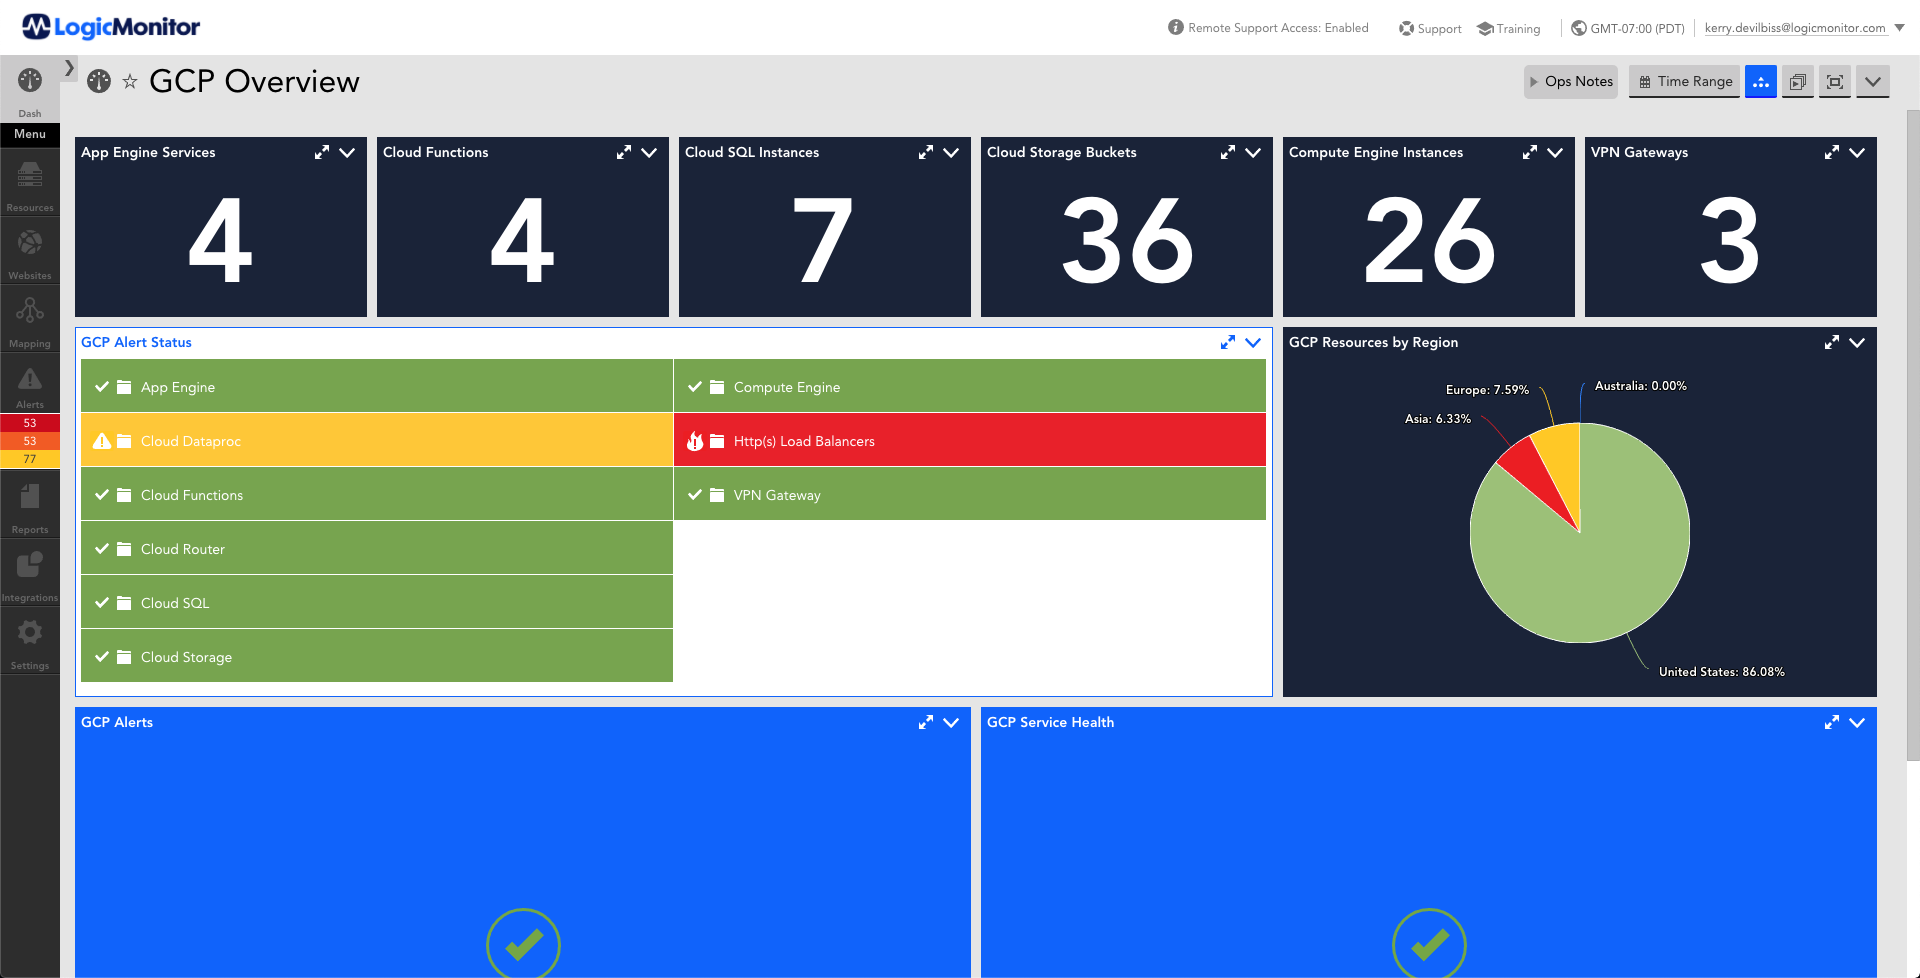
LM Cloud simplifies cloud monitoring and delivers comprehensive visibility into Google Cloud Platform (GCP) health and performance that is otherwise challenging to obtain.
View all GCP Dashboards on GitHub
Databases
View all Database Dashboards on GitHub
Hardware
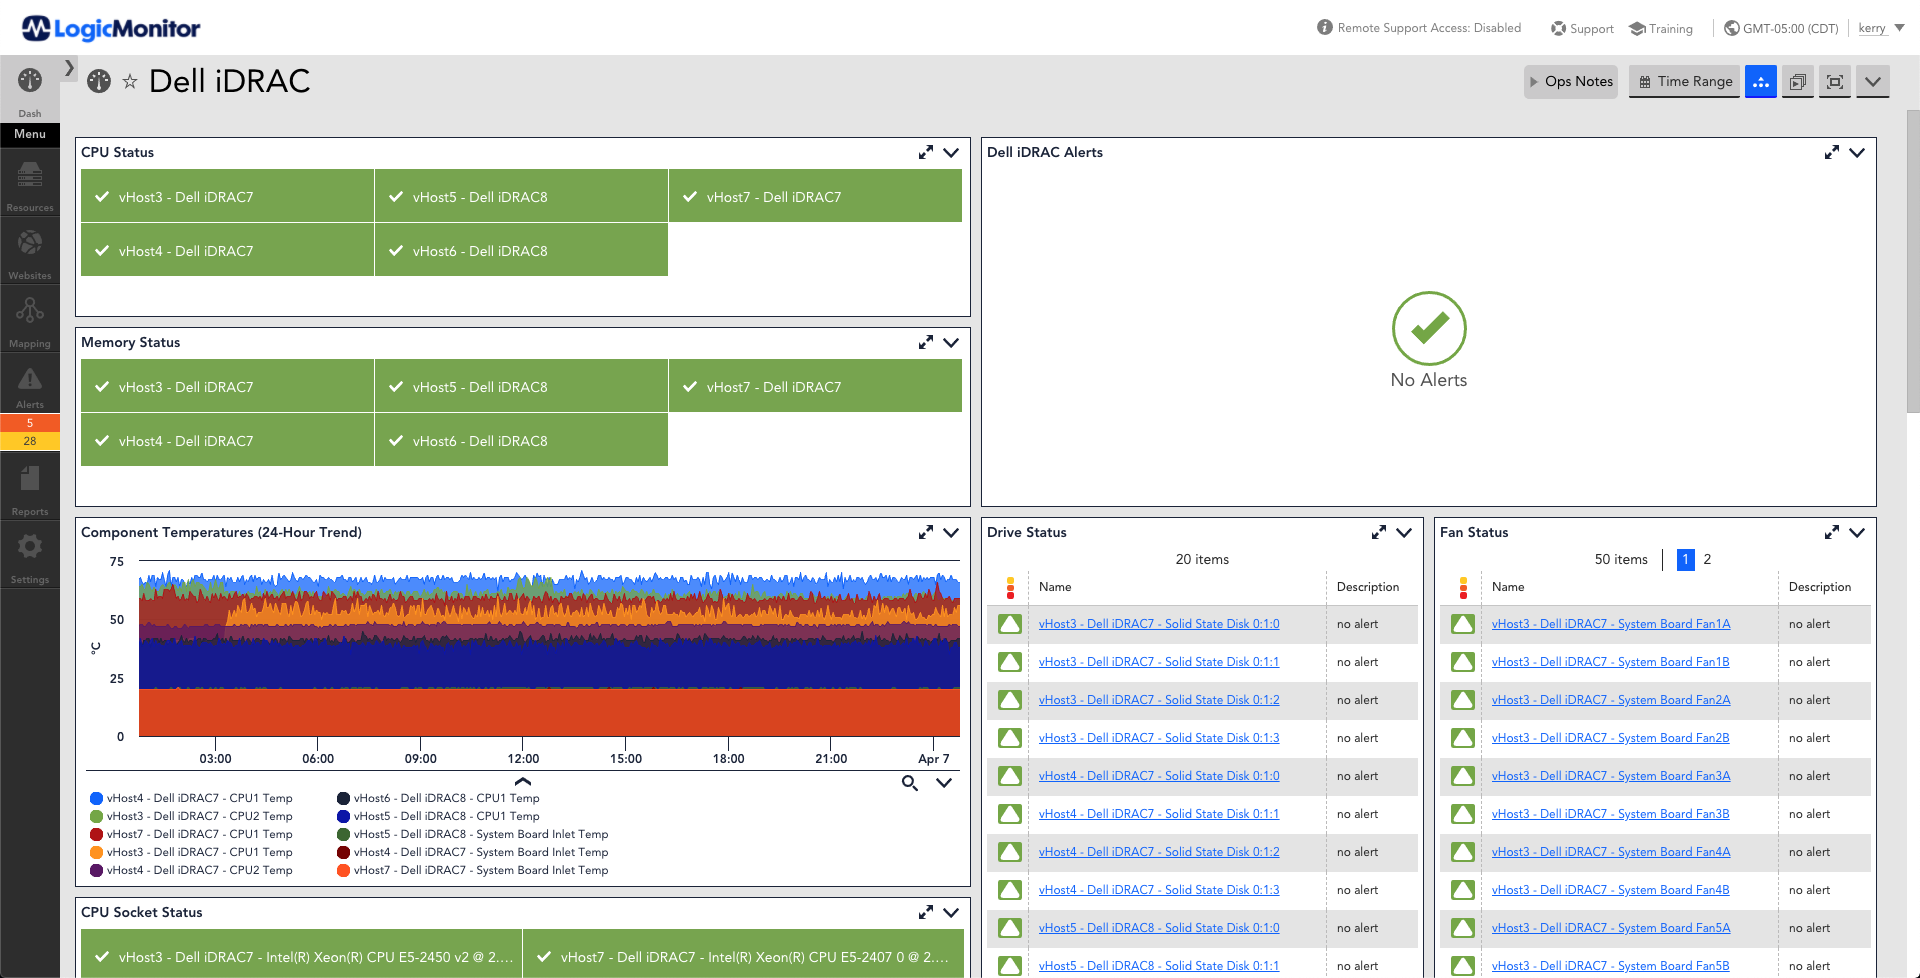
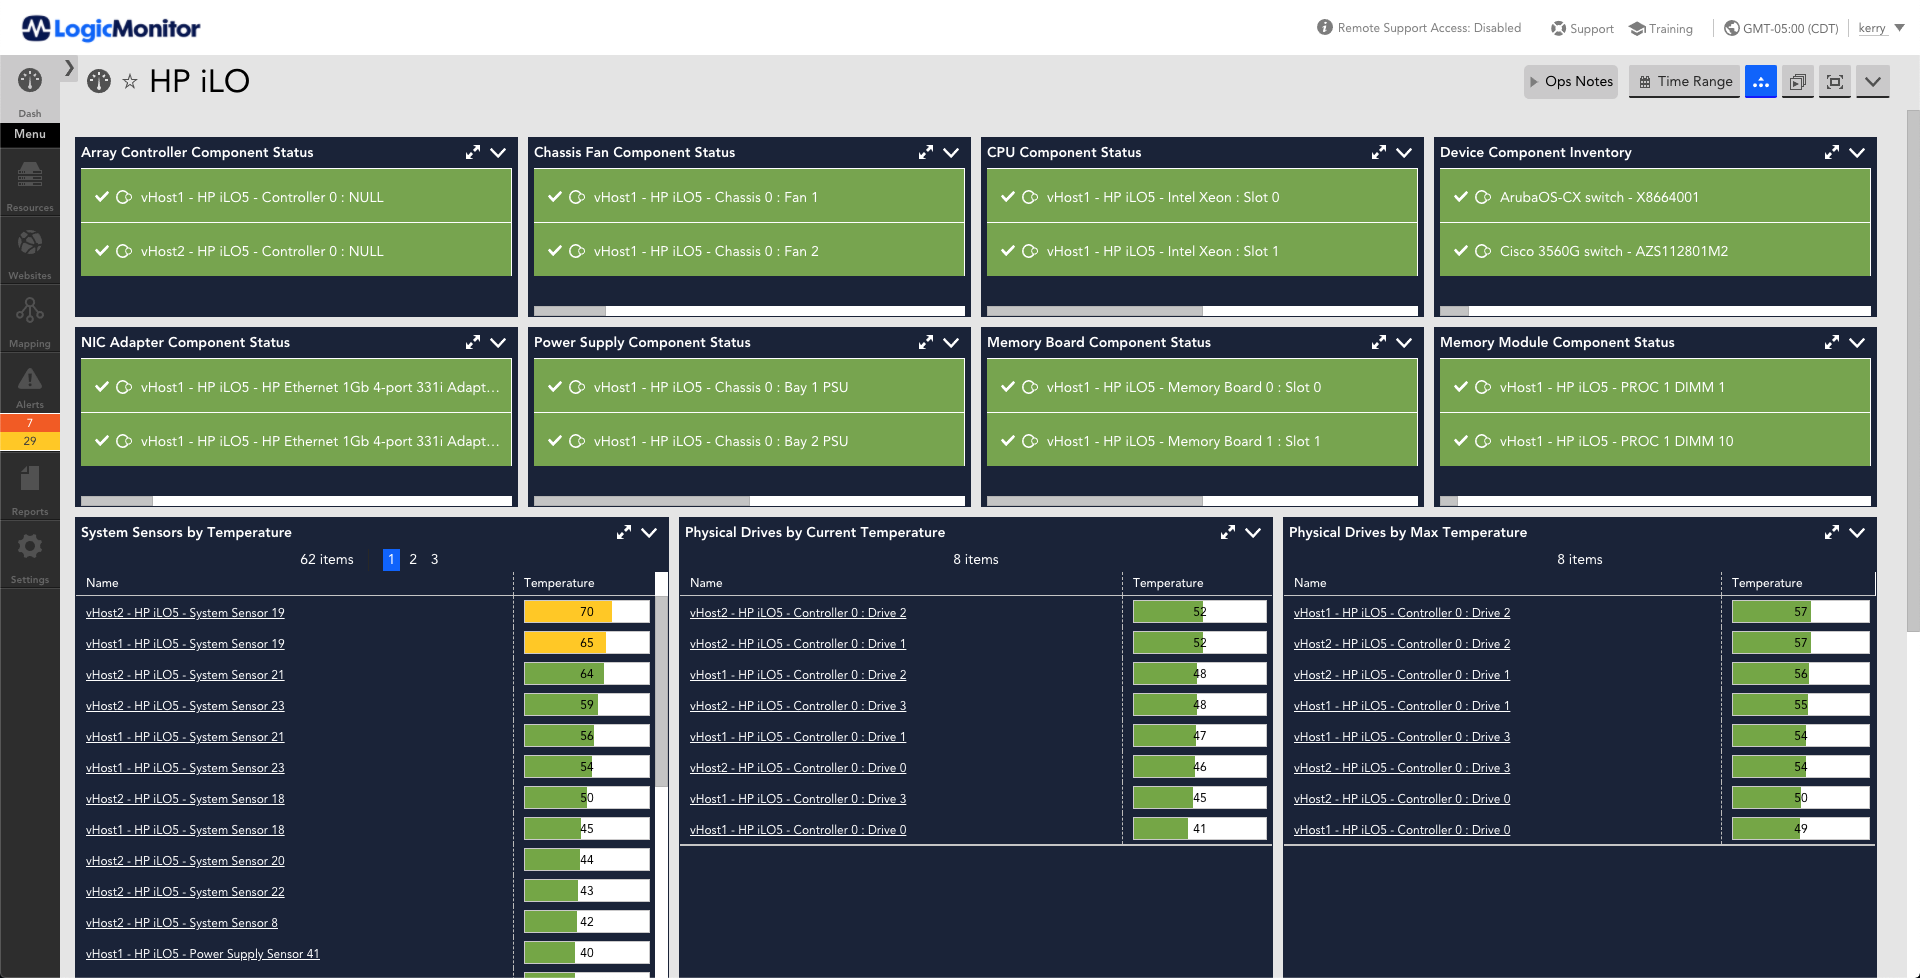
View all Hardware Dashboards on GitHub
Linux
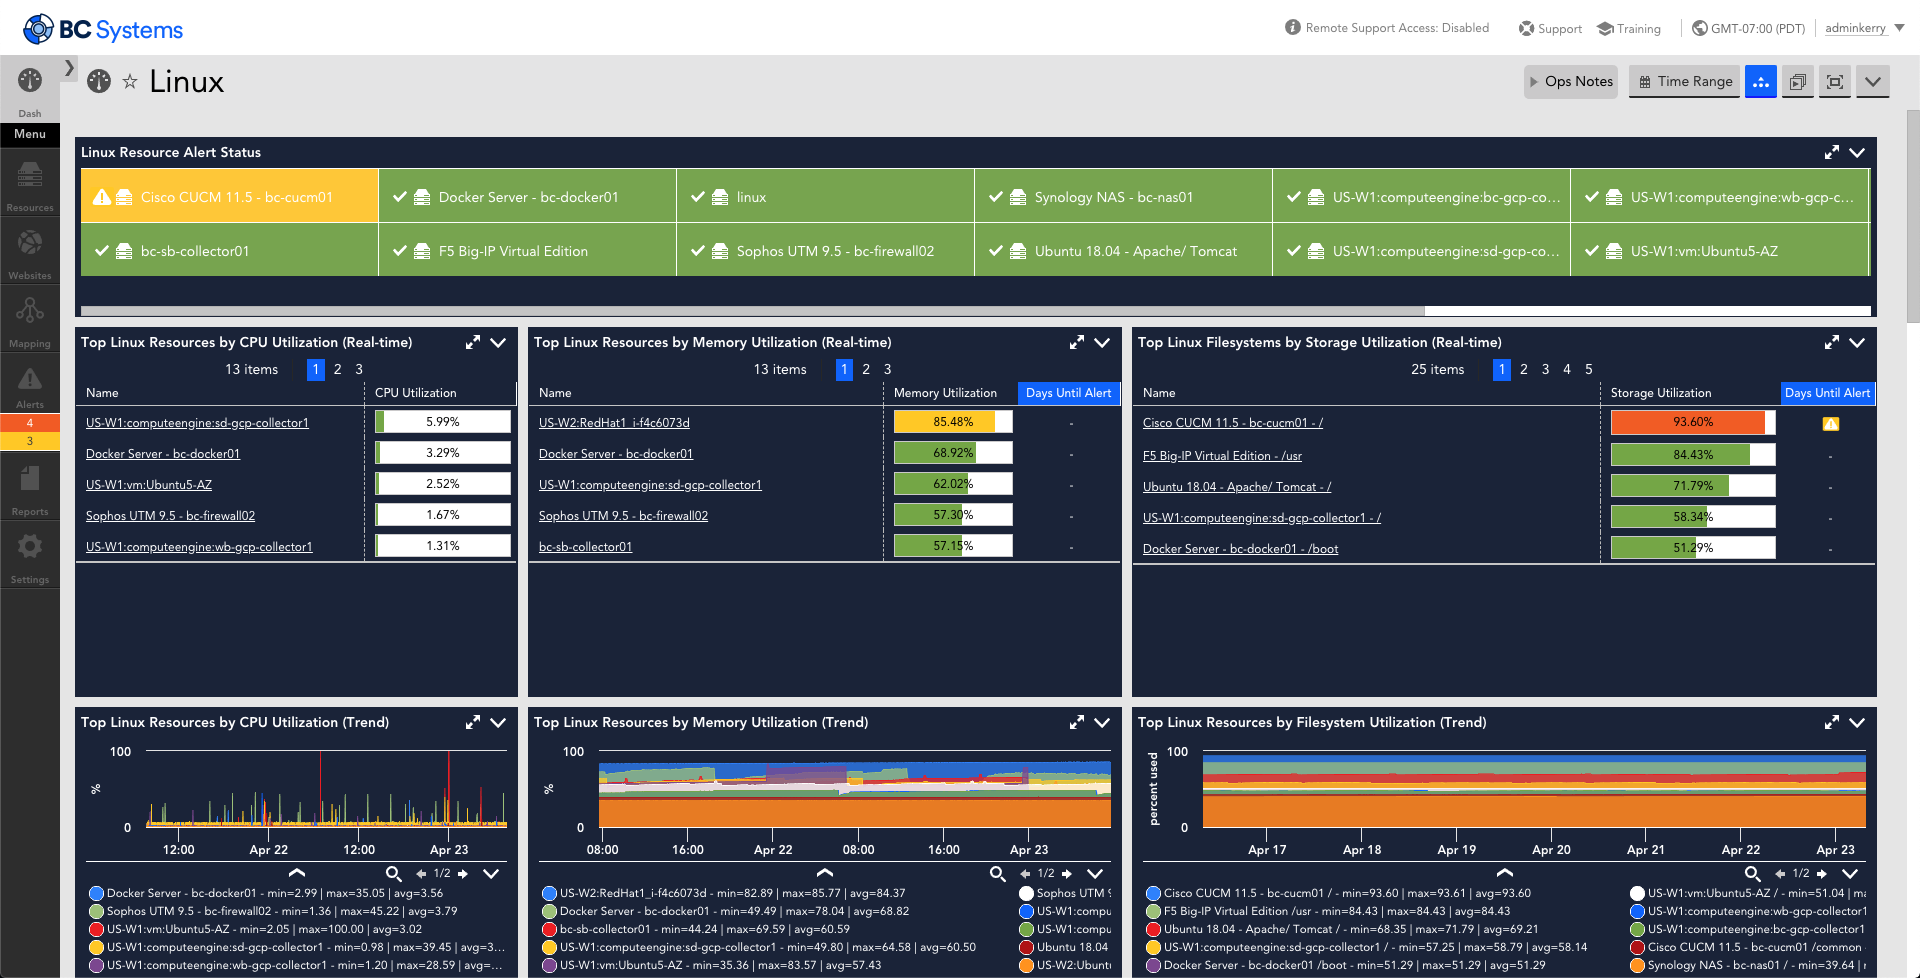
View all Linux Dashboards on GitHub
LogicMonitor
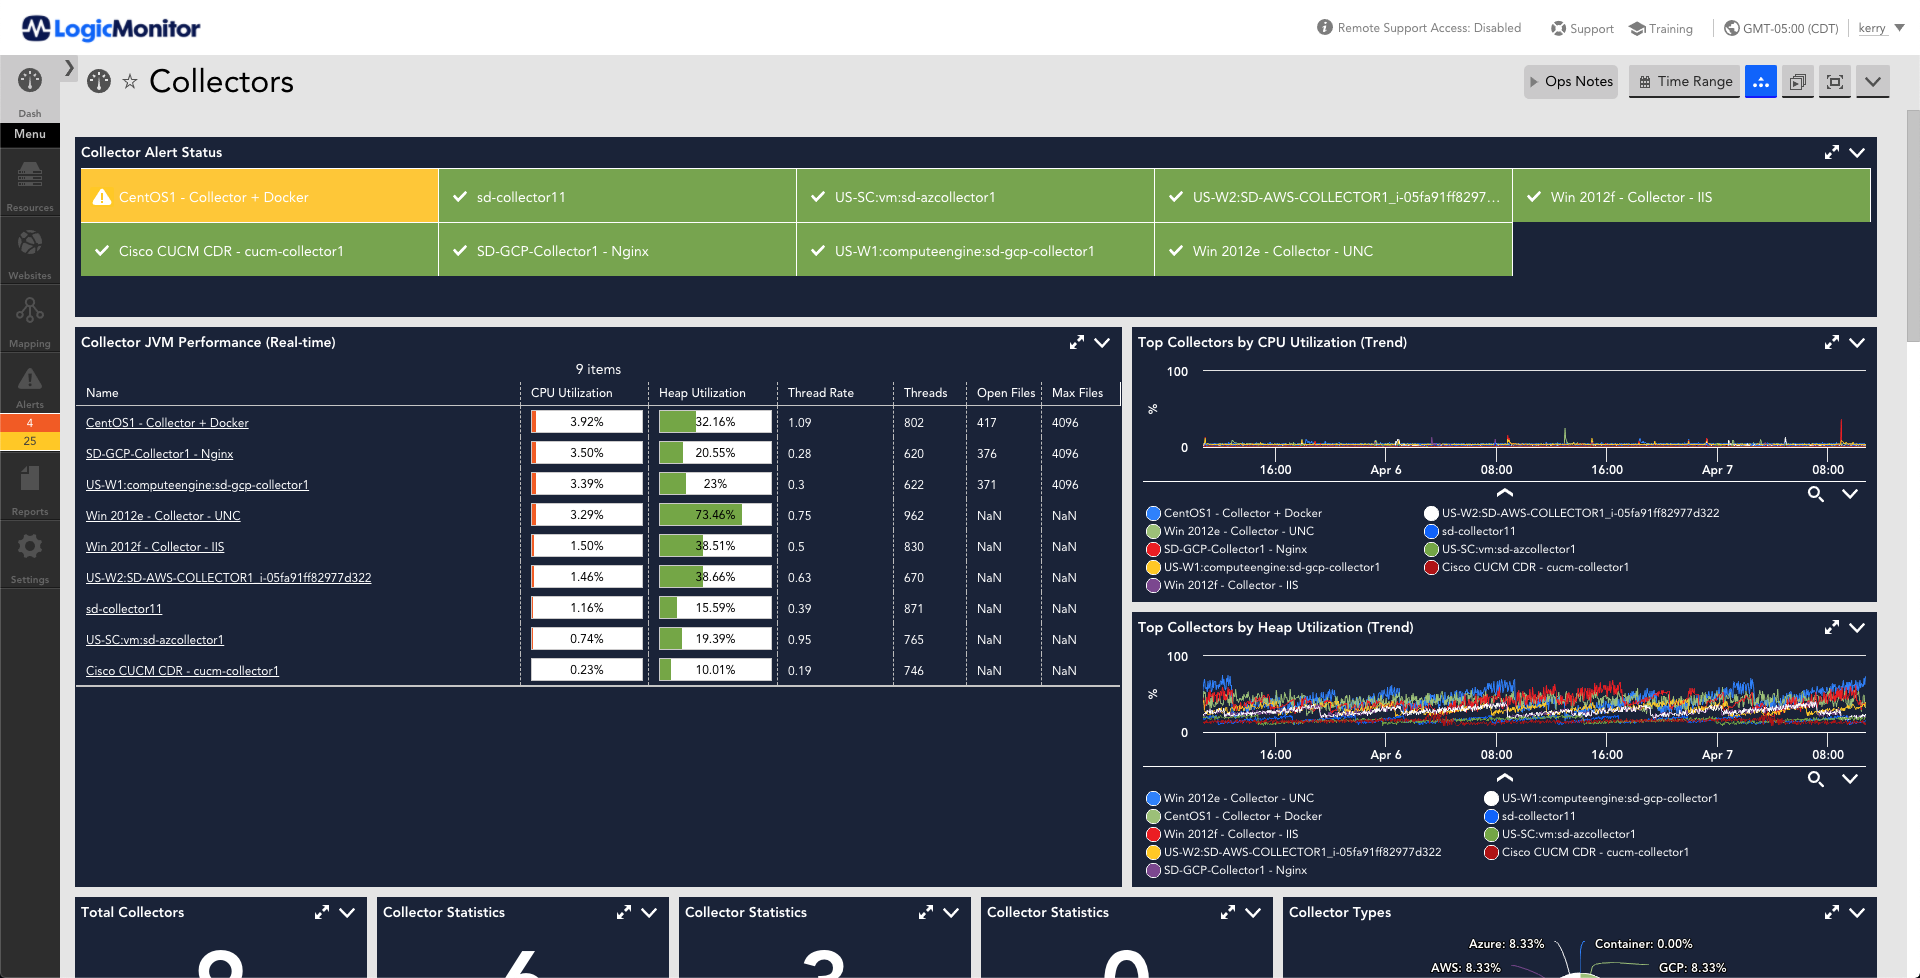
View all LogicMonitor Dashboards on GitHub
Microsoft
View all Microsoft Dashboards on GitHub
Network
View all Network Dashboards on GitHub
Storage
View all Storage Dashboards on GitHub
Virtualization
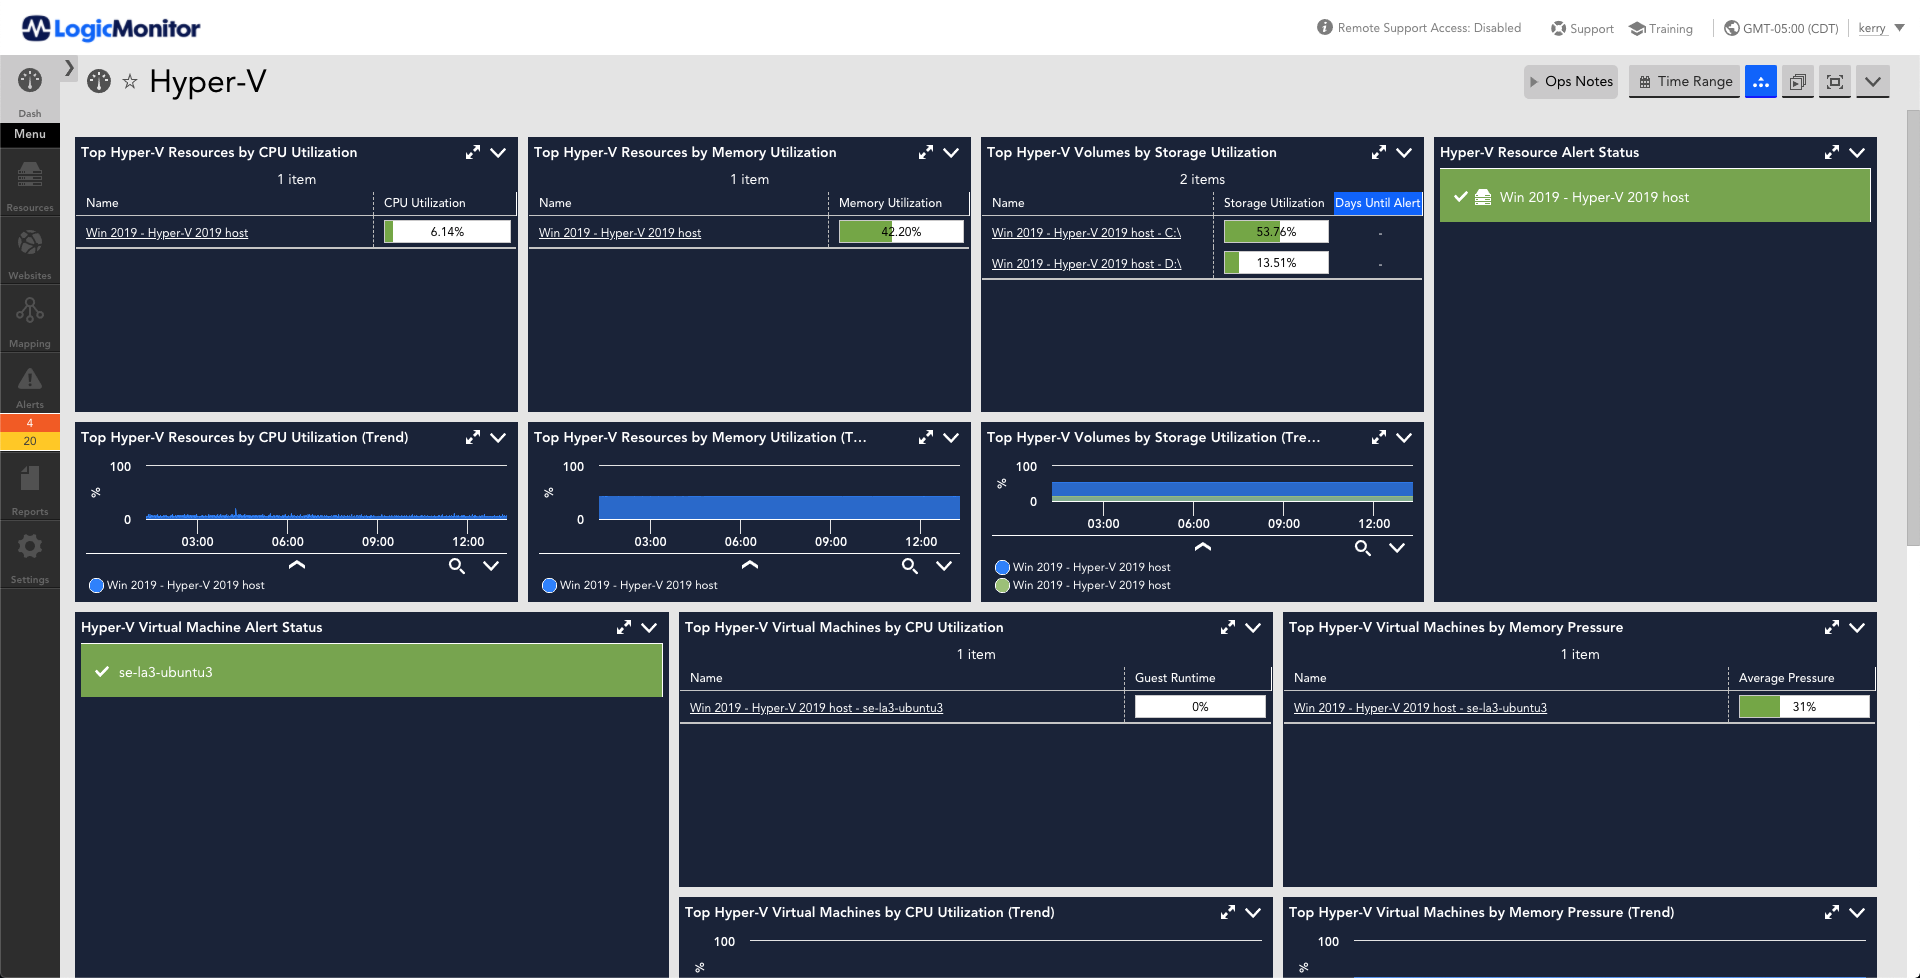
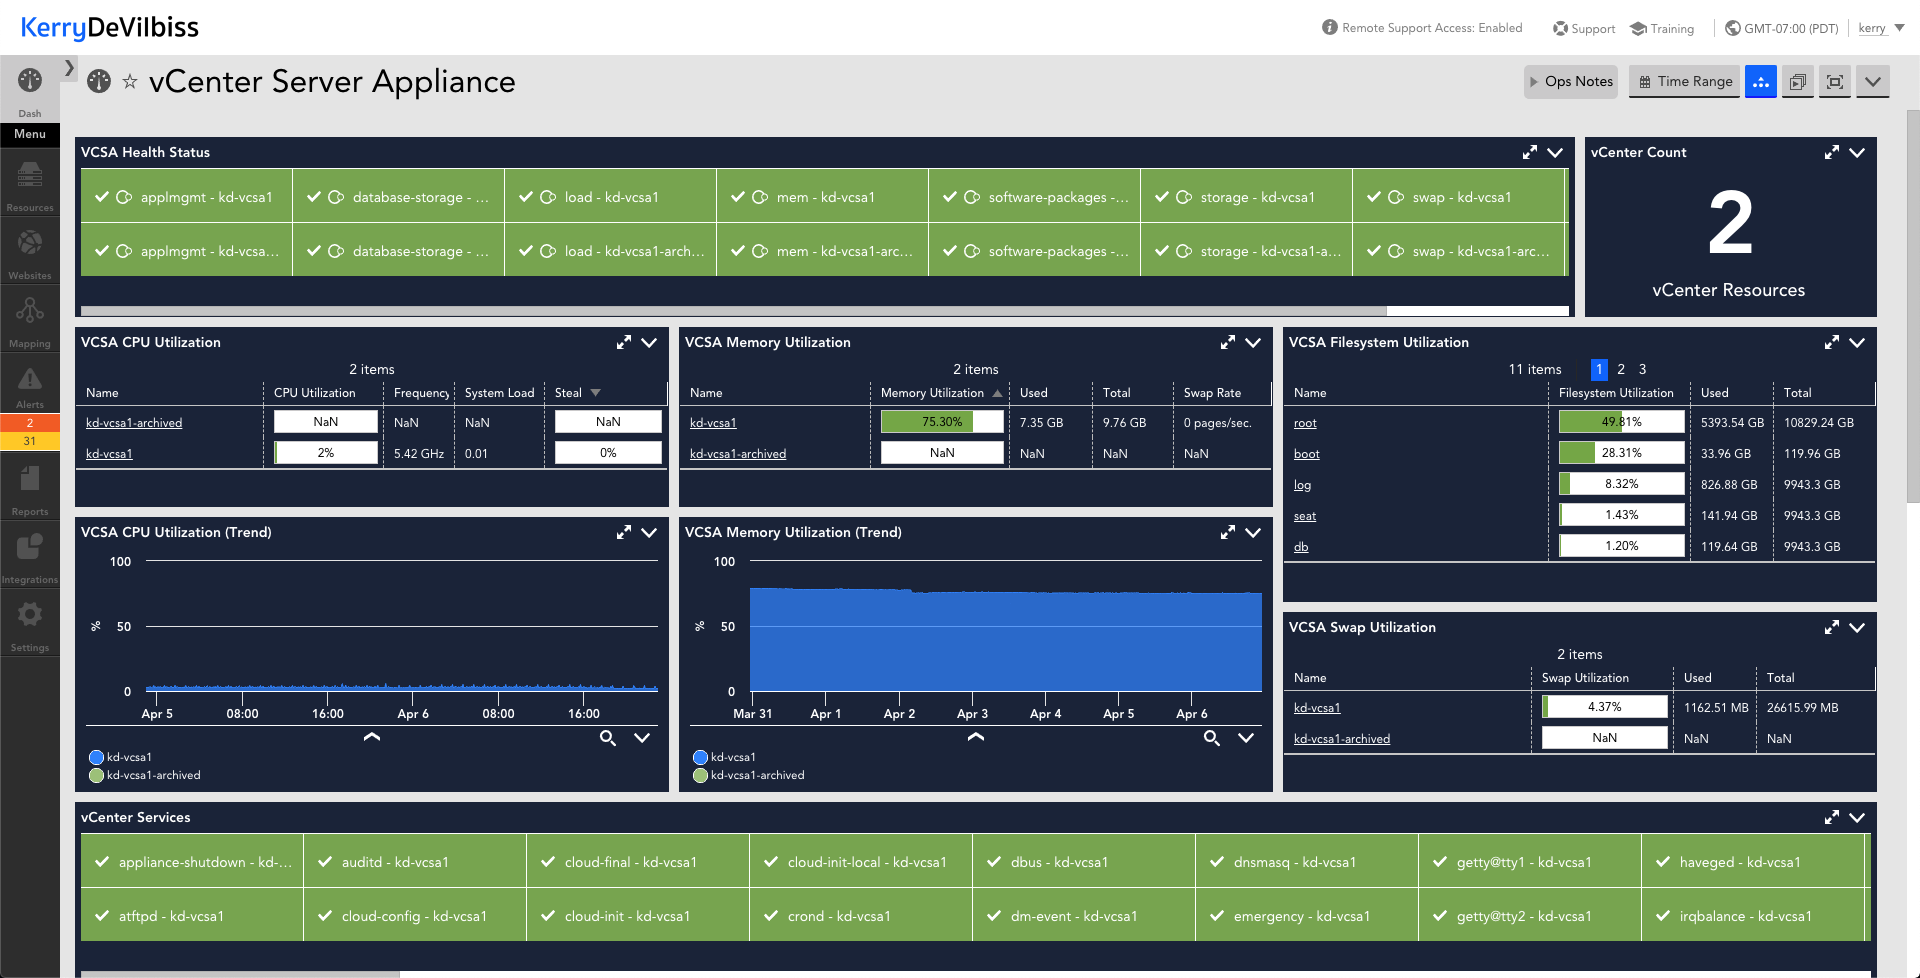
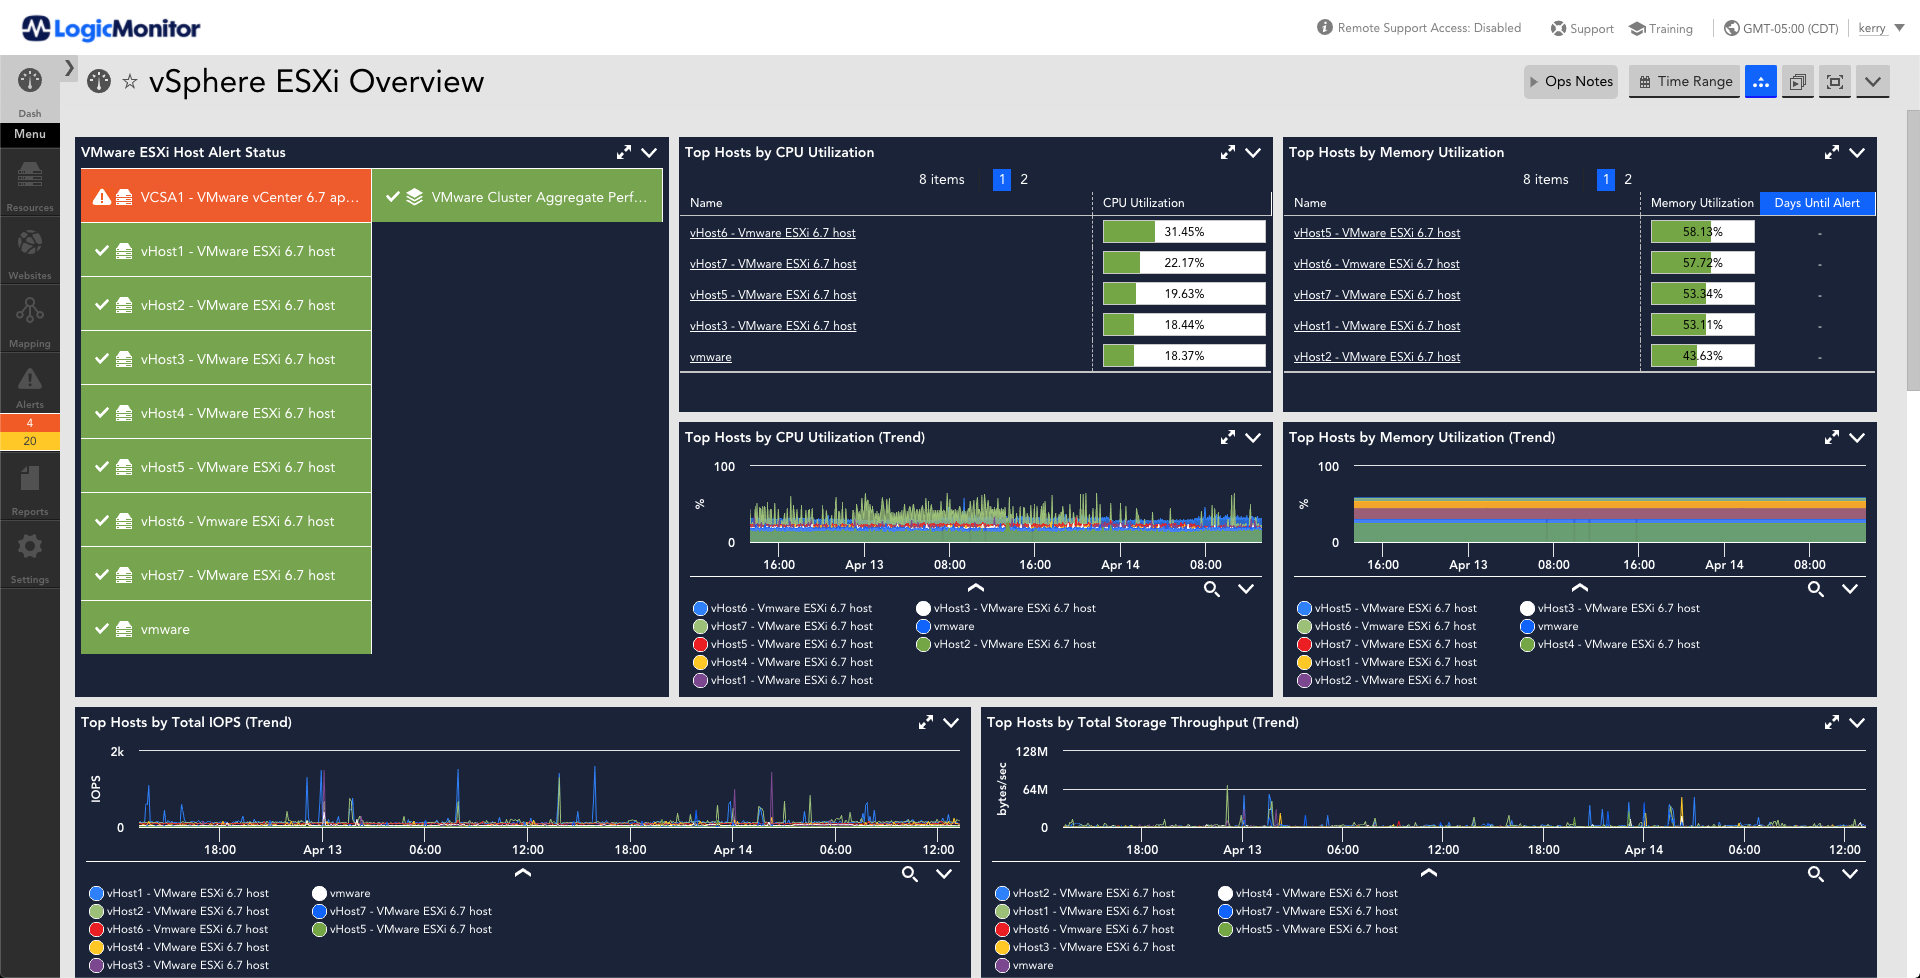
View all Virtualization Dashboards on GitHub
Dashboard Packages
LogicMonitor dashboard groups can be packaged as a single file export.
LogicMonitor: Managing Dashboards
The above dashboards are provided as a courtesy and represent a combination of those provisioned by LogicMonitor at time of account creation, and some custom additions. For more content, check the Github repository of dashboards. This page is a work in progress and no liability is assumed for bad spellings, bad links, or bad humor.
(Which doesn't mean someone won't help!)
© Copyright 2020
LogicMonitor Inc. |
Privacy |
Security |
Return to Top