
Dashboard Creation
Last updated - 26 August, 2025
You can create a dashboard from scratch to display new information or clone an existing dashboard to reuse existing dashboard information.
Creating a Dashboard
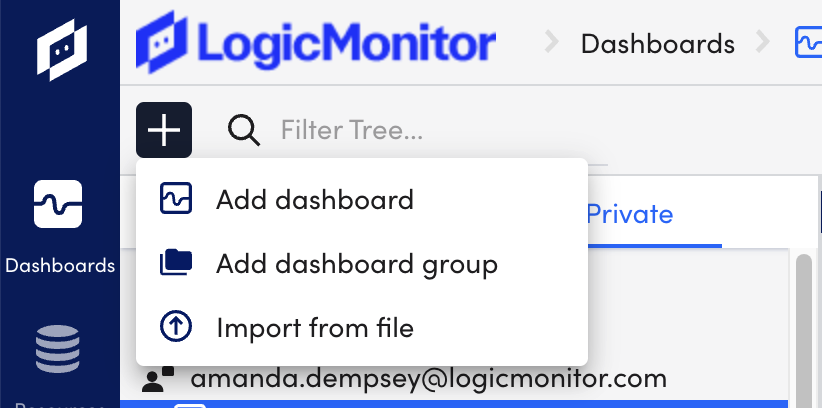
- In the top left of the Dashboards page, select the Add icon > Add dashboard.
- In the Name field, enter a name for the dashboard that doesn’t include operators and comparison functions.
- (Optional) In the Description field, enter a description for this dashboard to reference on the Manage Dashboards page at a later time.
- (Optional) Toggle on Make Private to make this dashboard available to your account only, and then select a Dashboard Owner. For more information, see Private Dashboards.
- (Optional) In the Dashboard Group field, enter the name of a dashboard group to assign your new dashboard to (suggested results are shown as you type). This field is not available for private dashboards.
- (Optional) Toggle on Add to Favorites to add this dashboard to your favorites list so you can more quickly navigate to it in the future.
- (Optional) Toggle on Make Default to make this the dashboard that initially displays each time you open the Dashboards page.
You can only set one dashboard as the default. - (Optional) Add default tokens or create custom tokens for this dashboard. For more information, see Dashboard Tokens.
- To configure a default filter, do the following in the Default filter settings:
- In the Filter by field, select
 to add a property filter.
 - Select the properties you want to use to create the default filter.
You can select as many properties as needed.
- In the Filter by field, select
- Select Save.
The dashboard is available in the dashboard tree. - Add widgets to your dashboard. For more information, see Widget Creation.
Cloning an Existing Dashboard
Warning: You must have at least one existing dashboard to clone a dashboard.
- Navigate to the dashboard you want to clone.
- In the top right of the dashboard, select the Overflow icon > Clone.
- (Optional) Modify the fields.
- When finished, select Save.
