Interface Mapping
Last updated – 30 December, 2025
With interface mapping, you can see how two network devices (for example switch or firewall) are connected through interfaces.
Requirements
Import the ‘Interface Mapping’ package provided by LogicMonitor in the LM Exchange.
Import LogicModules
From the LogicMonitor repository, import all Interface Mapping LogicModules, which are listed in the LogicModules in the Package section of this support article. If these LogicModules are already present, ensure you have the most recent version.
LogicModules in Package
LogicMonitor’s package for Network Topology consists of the following LogicModules. For full coverage, ensure that all of these LogicModules are imported into your LogicMonitor platform.
| Display Name | Type | Description |
| SNMP_Network_Interfaces | DataSources | Collects network interface performance and operational stats. |
| WinIf- | DataSources | Windows interface statistics |
| addCategory_TopoSwitch | PropertySources | Finds and tags switches capable of supporting topology discovery.Requires collector version 30.000 or greater. |
| addERI_Device (and any other vendor specific ERISources like addERI_Cisco) | PropertySources | Sets device External Resource IDs (ERIs) for layer 2 topology mapping of Cisco devices, including CDP global device ID using CISCO-CDP-MIB, LLDP local system name using LLDP-MIB, and MAC addresses using RFC1213-MIB. Sets ERI Type (ERT) by parsing the device’s properties for defined keywords, defaults to “Unknown” if not determined. |
| addERI_Windows | PropertySources | Sets device External Resource IDs (ERIs) for isWindows() using WMI for layer 2 topology mapping, including device interface MAC addresses. Sets ERI Type (ERT) by parsing the device’s properties for defined keywords, defaults to “PhysicalServer” if not determined.Requires collector version 30.000 or greater. |
| Networking_L2_snmpSwitch | TopologySources | Extracts layer 2 topologies from SNMP enabled switches.Requires collector version 30.000 or greater. |
Viewing Interface Mapping
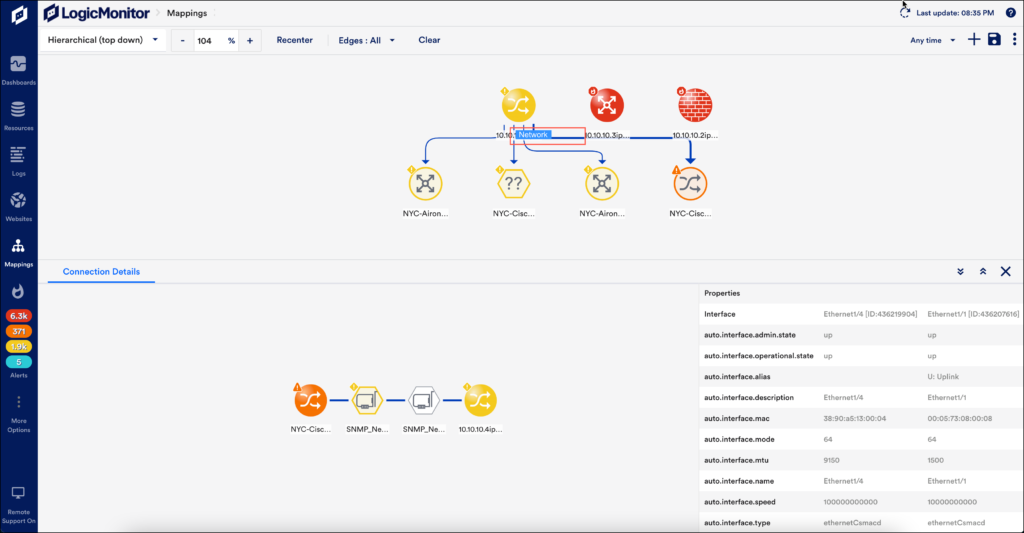
- In LogicMonitor, navigate to Mappings > Saved Maps and select the required map.
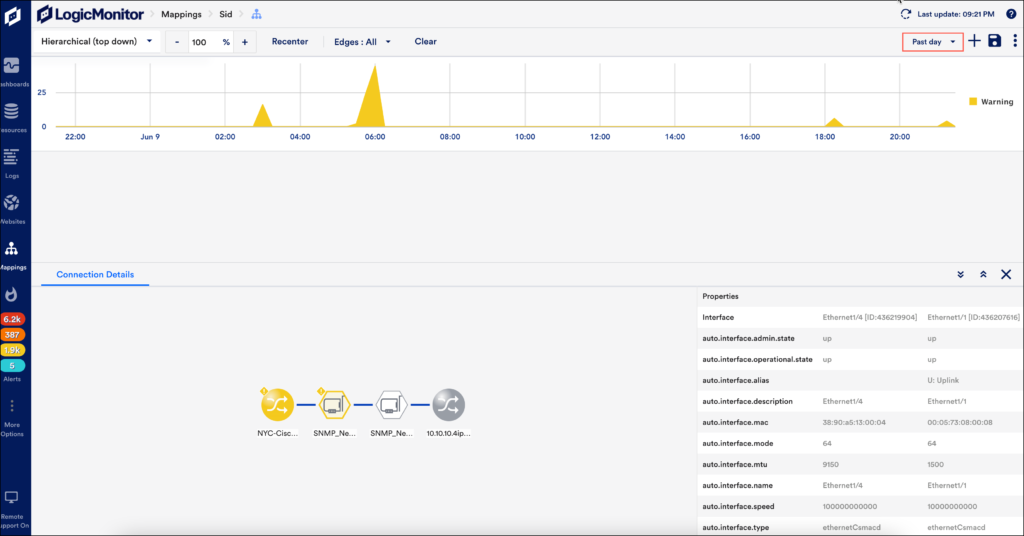
- Select the required connection for which you want to check the connection details.
A Connection Details tab along with the connection details map displays.
Note: A Connection Details tab along with the connection details map is displayed:
- Select the Connection Details tab to view the properties of the interfaces.
Note: If the interface is unavailable in the LogicMonitor portal, then the Properties information will not be displayed.
- You can view the connection details map that shows the connection between two resources.
- Select the More Options
icon located in the upper-right corner of the Mapping page and select “Header Graph”.
- Select Header Graph to view visual grouping alerts.
You can check the alerts on the Connection Details map for different time series.