
ESX Data Collection Method
Last updated - 25 July, 2025
The ESX collection method enables you to query data using the VMware API. To collect ESX data, you add and configure a datapoint that leverages the ESX collection method. This involves configuring settings to return one of the following results:
- VMware vCenter status
- Raw response of an ESX counter you choose to designate
Note: A LogicMonitor specific aggregation method can be appended to return more defined results for the counter.
Requirements for Configuring a Datapoint using the ESX Collection Method
To return raw responses of an ESX counter, the ESX counter must be supported by the VMware API.
Configuring a Datapoint using the ESX Collection Method
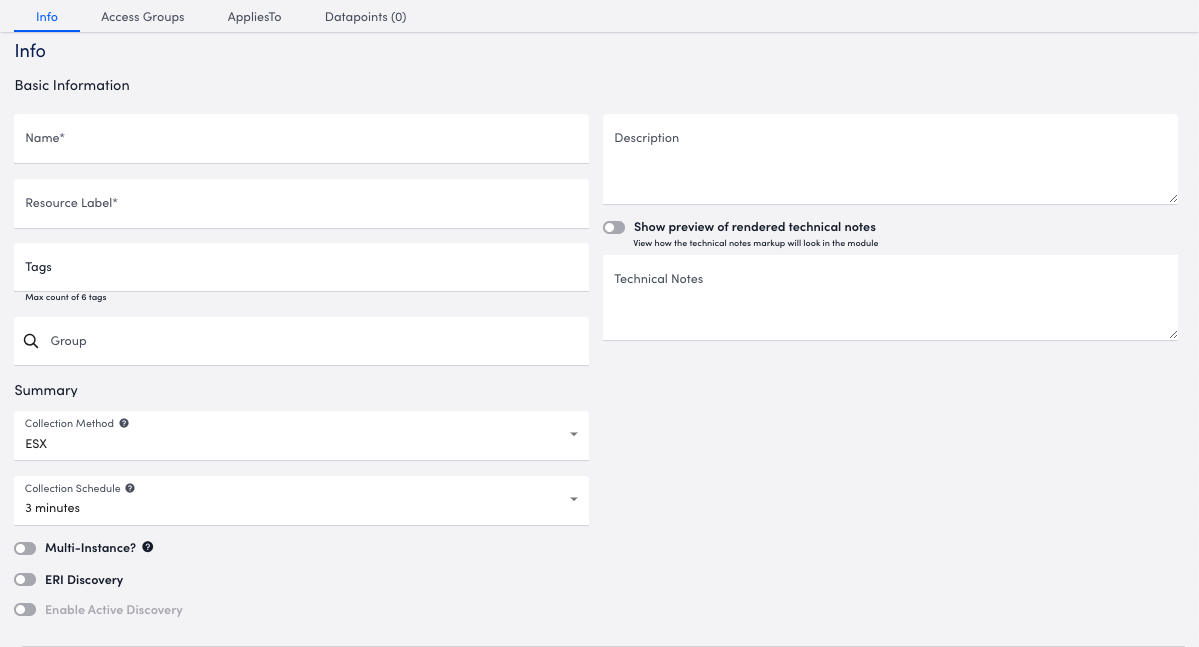
- In LogicMonitor, navigate to Modules, and either add a new DataSource or select the module you want to add a datapoint to for collecting ESX data.
For more information, see Custom Module Creation or Modules Management. - Configure or modify the module as needed, and ensure “ESX” is selected from Collection Method.
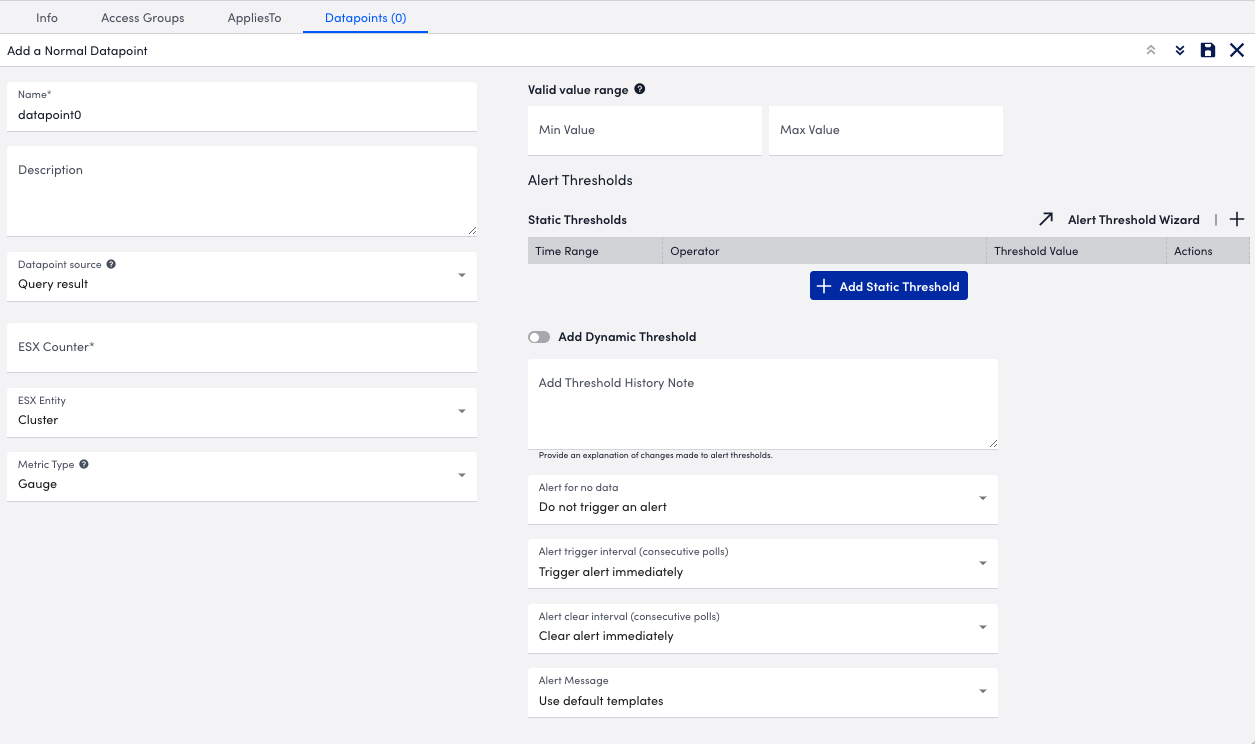
- To configure the normal datapoint to collect ESX data, select Add a Normal Datapoint.
- In the Name field, enter a name for the datapoint.
- In the Description field, enter a description.
- From Datapoint source, select the results you want to return using the following:
- To return the VMware vCenter status, select “Query Status.”
This enables the DataSource to identify the source of an inaccessible VM, whether the issue stems from the VM itself or vCenter. - To return the raw response of the ESX counter, select “Query Result,” and do the following:
- In the ESX Counter field, enter the counter you want a response for (for example, “disk.numberRead.summation”). You can append an aggregation method as needed (for example, “disk.numberRead.summation:sum”)
LogicMonitor supports the following aggregation methods:- :sum—Normally, the ESX API returns the average of summation counters for multiple objects when queried against a virtual machine. When “:sum” is appended, LogicMonitor collects the sum.
For example, if “disk.numberRead.summation” is the counter, a virtual machine with two disks, reporting 20 and 40 reads per second respectively, returns 60 reads per second for the virtual machine, rather than 30 reads per second. - :average—LogicMonitor divides the sum by the number of instances to return an average.
- :sum—Normally, the ESX API returns the average of summation counters for multiple objects when queried against a virtual machine. When “:sum” is appended, LogicMonitor collects the sum.
- From ESX Entity, select the entity you want to return a response for.
- From Metric Type, select the type of metric you want the response stored as.
- In the ESX Counter field, enter the counter you want a response for (for example, “disk.numberRead.summation”). You can append an aggregation method as needed (for example, “disk.numberRead.summation:sum”)
- To return the VMware vCenter status, select “Query Status.”
- Configure or modify the additional settings for the datapoint as needed.
- Select
 Save.
Save.
The datapoint is saved for the module and you can configure additional settings for the module as needed. For more information, see Custom Module Creation or Modules Management.
