
Linux (SSH) Monitoring
Last updated - 15 May, 2026
LogicMonitor offers monitoring for Linux systems that leverages the SSH protocol to collect various metrics including CPU, memory, and filesystem utilization; uptime; and throughput to name a few. However, this monitoring is designed only for the systems where SNMP is not configured. If SNMP is configured, more robust out-of-the-box monitoring will activate and there is no need to configure the SSH monitoring provided by this Linux SSH package.
Requirements
- Add your Linux host into monitoring
For more information on adding resources into monitoring, see Adding Devices.
- SSH must be configured on the Linux host for the DataSources to apply.
You can authenticate the Collector’s access to the device using an SSH public-private key pair instead of a password. This requires you to generate the SSH key pair and copy the public key to the Collector’s host that is assigned to the device in LogicMonitor and the device.
To use an SSH key pair, you need the following:- A valid home directoryThe SSH server verifies with
~/.ssh/authorized_keyswhen authenticating incoming connections. - The key pair in classic OpenSSH format (.pem)
- A valid home directoryThe SSH server verifies with
Note: Use the How to Use ssh-keygen to Generate a New SSH Key? documentation from SSH and the following command to generate the key pair in classic OpenSSH format:
ssh-keygen -m PEM
- From the LogicMonitor public repository, import all Linux SSH LogicModules, which are listed in the LogicModules in Package section of this support article. If these LogicModules are already present, ensure you have the most recent versions. Ater the LogicModules are imported (assuming all previous setup requirements have been met), the suite of DataSources will automatically begin collecting data.
Assign Properties to Resources
SSH credentials must be set as properties on the Linux resource within LogicMonitor. These properties allow LogicMonitor to pass the appropriate credentials onto the Linux host for authentication. It is strongly recommended that you do not provide a privileged user.
For more information on setting SSH authentication credentials as properties, see Defining Authentication Credentials.
The LogicModules in this package do not require any specialized permissions to monitor Linux via SSH. LogicModules in other monitoring packages may require additional permissions; these will be specified in their respective support articles. The lack of a need for special permissions has been confirmed through testing against clean installations of Debian, Ubuntu Server and CentOS, but does not account for additional hardening steps that may have been applied to a system.
Adding Instances for Linux SSH Control Groups and Service Status
The Control Groups and Service Status DataSources do not have Active Discovery enabled from their DataSource definitions and will require either the manual addition of instances or the enabling of Active Discovery via the scripts provided below. These DataSources have been configured in this way because the automatic enabling of Active Discovery for all cgroups and services on a given host has the potential to produce too many instances, causing rapid alert flooding in the LogicMonitor platform or an unmanageable list of instances.
For this reason, we recommend manually adding selected cgroups and services as monitored instances, as outlined in the following two sections.
The following instructions assume a minimum version installation of Linux kernel 2.6.24. LogicMonitor’s Control Groups and Service Status DataSources are verified to be compatible with the following Linux distros:
- CentOS
- Debian
- Oracle Linux
- RHEL
- Ubuntu
Finding and Manually Adding Control Groups as Instances
The following set of instructions uses a Docker container as an example of a cgroup we would like to monitor.
-
From the command line, run:
systemd-cgtop -n1 -bThis command displays the cgroups that are using the most resources. The
-n1flag (shorthand for--iterations=1) denotes that we only want one iteration of the command to execute. The-bflag (short for--batch) forces the command to run in “batch” mode—in other words, do not accept input and run until the iteration limit set is exhausted or until killed). - From the resulting output, copy the name of the control group you want to monitor excluding the parent container. In the example below, we will add
atd.serviceexcludingsystem.slice/.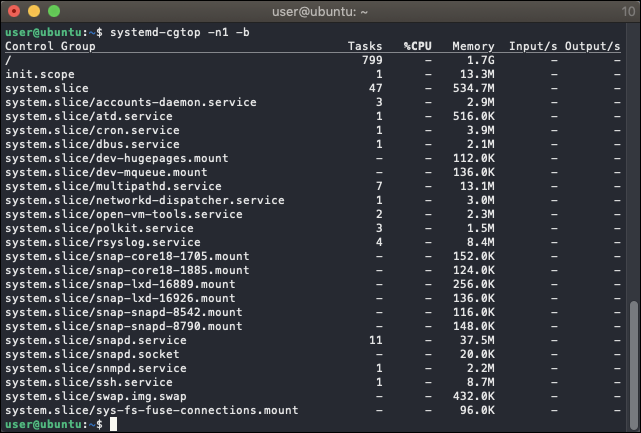
Note: Unless “CPUAccounting=1” and “MemoryAccounting=1” are enabled for the services in question, no resource accounting will be available and the data shown by systemd-cgtop will be incomplete.
- Navigate to the Linux host on the Resources page and select ‘Add Monitored Instance’ from the dropdown menu located next to the Manage menu. For more information on manually adding instances, see Adding Instances.
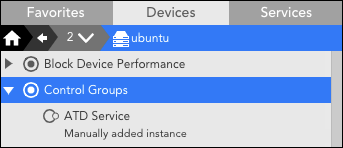
- In the Add Monitored Instance dialog, enter “Control Groups” in the DataSource field and enter “atd.service” in the Wildcard Value field. Enter whatever you would like this instance to be called in the Name field (you may use the wildcard value if you like). Optionally, you may also add a description.
- After completing the dialog, click Save. If the action was successful, you’ll be able to see the instance under the DataSource on the Resources page.
- To verify data collection is successful, navigate to the Raw Data tab for this instance and click Poll Now.
Finding and Manually Adding Services as Instances
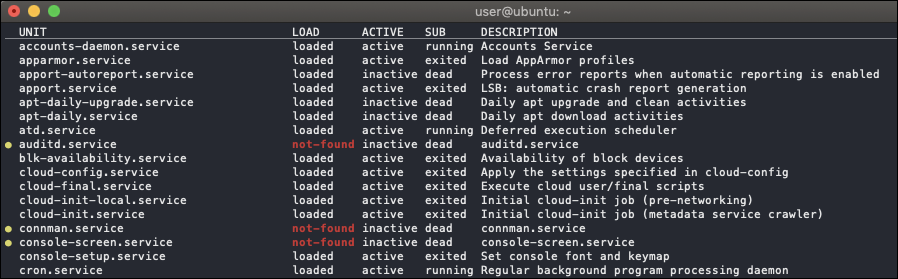
- From the command line, run:
systemctl list-units -a --type=serviceThis command displays all units that systemd loaded or attempted to load, regardless of their current state on the system. The
-aflag (shorthand for--all) ensures all units are listed including those which are inactive. The--type=serviceflag returns only service units. - From the resulting output, copy the name of the service you want to monitor from the UNIT column.
- Follow the steps listed for control groups above to manually create an instance for a service using “Service Status” in the DataSource field and the copied service name in the Wildvalue field.
Note: Services can be added manually by specifying the linux.ssh.services property on the resource.
Enabling Active Discovery for Automatic Instance Adding
If you are confident that your system will not be overwhelmed with an unmanageable number of instances, you may enable Active Discovery from the DataSource definition and embed the corresponding Groovy script as a parameter of the “SCRIPT” discovery method. (See What Is Active Discovery? for more information on configuring Active Discovery for a DataSource.)
Active Discovery Script for the Linux_SSH_Cgroups DataSource Definition
/*******************************************************************************
*  © 2007-2024 - LogicMonitor, Inc. All rights reserved.
 ******************************************************************************/

import com.santaba.agent.groovy.utils.GroovyScriptHelper as GSH
import com.logicmonitor.mod.Snippets

def azureHost = hostProps.get("auto.network.resolves") == "false" ? hostProps.get("system.azure.privateIpAddress")
                                                                  : null
def loader = GSH.getInstance(GroovySystem.version).getScript("Snippets", Snippets.getLoader())
def remote = loader.load("lm.remote", "0").create(hostProps)
                                          .withHost(azureHost ?: hostProps.get("system.hostname"))
                                          .withKey(hostProps.get("ssh.pass") ? "" : hostProps.get("ssh.cert", "~/.ssh/id_rsa"))
                                          .withTimeout(15000)


// Expected output pattern capturing cgroup name, tasks, CPU, memory, input, output.
// Unless "CPUAccounting=1" and "MemoryAccounting=1" are enabled for the services in question,
// no resource accounting will be available and the data shown by systemd-cgtop will be incomplete.
def line_pattern = ~/^\/?([^\/]+)\/(\S+)\s+(\S+)\s+(\S+)\s+(\S+)\s+(\S+)\s+(\S+)\s*$/

def command_output = remote.exec('systemd-cgtop -n1 -b --cpu=percentage')

command_output.eachLine { line ->
    def matcher = line_pattern.matcher(line) ?: [:]

    // Process lines that contain a match except cgroups in user.slice
    if (matcher.size() > 0 && matcher[0][1] != "user.slice" && matcher[0][1] != "docker") {
        // Replace invalid wildvalue characters with underscores
        def wildvalue   = matcher[0][2].replaceAll(/[:|\\|\s|=]+/,"_")
        def cgroupPath  = matcher[0][1].replaceAll(/[:|\\|\s|=]+/,"_")

        println "${wildvalue}##${wildvalue}######auto.cgroup.path=${cgroupPath}"

    }
}

return 0Active Discovery Script for the Linux_SSH_ServiceStatus DataSource Definition
The Service Status DataSource has default alerts that you may want to adjust when monitoring all services.
/*******************************************************************************
*  © 2007-2024 - LogicMonitor, Inc. All rights reserved.
 ******************************************************************************/

import com.santaba.agent.groovy.utils.GroovyScriptHelper as GSH
import com.logicmonitor.mod.Snippets

def azureHost = hostProps.get("auto.network.resolves") == "false" ? hostProps.get("system.azure.privateIpAddress")
                                                                  : null
def loader = GSH.getInstance(GroovySystem.version).getScript("Snippets", Snippets.getLoader())
def remote = loader.load("lm.remote", "0").create(hostProps)
                                          .withHost(azureHost ?: hostProps.get("system.hostname"))
                                          .withTimeout(15000)

def debug = false

//Pull in the list of services to monitor from the device properties
def services = hostProps.get("linux.ssh.services")?.split(",") ?: []

// Expected pattern of output lines with data
def line_pattern = ~/^\/?\s*(\S+)\s+(\w*loaded|not-found|masked\w*)\s+(\w*active|inactive|failed\w*)\s+(\S+)\s+(.*)$/

// Run command to show any unit that systemd loaded or attempted to load, regardless of its current state on the system.
def command_output = remote.exec('systemctl list-units --all --type=service --plain')

if (services.size() > 0) {
    print debug ? "DEBUG MODE -- LIST OF AVAILABLE SERVICES\n" : ""

    command_output.eachLine { line ->
        def match= line_pattern.matcher(line) ?: [:]
        if (match.size() > 0) {
            def service = match[0][1]
            def description = match[0][5].trim() ?: ""

            if(services.contains(service)) {
                println "${service}##${service}##${description}####"
            }

            print debug ? String.format("%-30s %-30s\n", service, description) : ""
            print debug ?  "----------------------------------------\n" : ""
        }
    }
}

return 0LogicModules in Package
LogicMonitor’s package for monitoring Linux via SSH consists of the following LogicModules. For full coverage, please ensure that all of these LogicModules are imported into your LogicMonitor platform.
| Display Name | Type | Description |
| addCategory_Linux_SSH | PropertySource | Assigns a value of “Linux_SSH” to the system.categories property for hosts (excluding AWS and Azure) which have not been properly identified due to unconfigured SNMP, and attempts to connect via SSH using the properties set on the resource/Collector. |
| Linux_SSH_Info | PropertySource | Gathers Linux system information such as kernel name, kernel release, kernel version, hardware name, hardware platform, node name, processor type, and operating system. |
| Block Device Performance | DataSource | Monitors I/O for disks and partitions on Linux systems via SSH. |
| Control Groups | DataSource | Linux Control Groups resource and task usage via the systemd-cgtop command. |
| Control Group Status | DataSource | (DEPRECATED August 2020) Linux Control Groups status monitoring via the systemd-cgtop command. |
| CPU Cores | DataSource | Monitors CPU usage per core via SSH. |
| CPU / Memory | DataSource | Monitors Linux CPU and Memory statistics via SSH. |
| Filesystems | DataSource | Monitors the Linux filesystem utilization metrics. |
| Network Interfaces | DataSource | Monitors Linux network interfaces metrics such as throughput, packet transmission, errors, packet drops, collisions and operating status. |
| Service Status | DataSource | Linux systemd services via the systemctl command. |
| TCP / UDP Stats | DataSource | Retrieves TCP and UDP statistics from netstat. |
| Uptime | DataSource | Monitors the Linux hosts uptime via SSH. |
