
About LogicMonitor Container Monitoring
Last updated – 17 March, 2026
What is Container Monitoring? What are the advantages of Container Monitoring?
LM Container provides organizations insight into the performance of applications running in containers and the health of the underlying container resources and orchestrating components.
To get the most out of deployment, LogicMonitor presents these insights alongside your organization’s existing monitored hybrid infrastructure in a single, unified platform.
Containers create a dynamic environment that is difficult to monitor because container resources are ephemeral. An effective monitoring solution has to be able to detect and monitor containers while they exist, understand when they disappear, and retain data about the performance of the service or application that is running in the container.
LogicMonitor addresses these challenges with Container Monitoring.
What is Kubernetes Monitoring?
LM Container monitors your Kubernetes-orchestrated container environment and the applications running within the hybrid infrastructure on a single pane of glass. LM Container provides automated monitoring and pre-configured alert thresholds for Kubernetes cluster components (containers, nodes, pods, and services), container health, and application performance.
How to monitor Kubernetes with LogicMonitor?
Kubernetes allows DevOps teams to deploy containerized applications faster and makes managing containers at a scale significantly easier. For more information, see Kubernetes documentation.
With LogicMonitor’s new Kubernetes Monitoring Integration, you can comprehensively monitor your Kubernetes clusters and the containerized applications running within them, alongside your
existing hybrid IT infrastructure on a single pane of glass.
LogicMonitor uses API to ensure that your monitoring is always up to date, even as the resources within the cluster change. Data is automatically collected for Kubernetes nodes, pods, containers, services, and master components (e.g. scheduler, api-server, controller-manager). Pre-configured alert thresholds provide meaningful alerts out of the box.
What does Kubernetes monitoring do and what are the advantages of LogicMonitor’s implementation of Kubernetes monitoring?
LogicMonitor’s event-based Kubernetes monitoring:
- Eliminates the need to have an agent on every node (unlike some other container monitoring tools).
- Automatically adds and removes cluster resources from monitoring (including nodes, pods, and services).
- Offers comprehensive performance and health metrics at both the cluster and application levels.
- Stores data for up to two years (unlike Prometheus, an open-source monitoring alternative).
- Provides insight on underutilized resources (including CPU and memory) for maximum optimization.
- Allows you to create intuitive out-of-the-box dashboards. For more information, see Kubernetes Dashboards.
How can I estimate the number of resources monitored by LogicMonitor?
LogicMonitor can detect and monitor several resources in your Kubernetes cluster such as Pods, Nodes, Services, etc.
Our billing model is based on the number of devices that you monitor, and LM Container treats each Kubernetes object instance as a device. To estimate the number of devices that incur charges, follow these steps:
- Check the various Kubernetes-supported objects for monitoring the required objects. For more information, see the Supported Resources section in the About LogicMonitor’s Kubernetes Monitoring article.
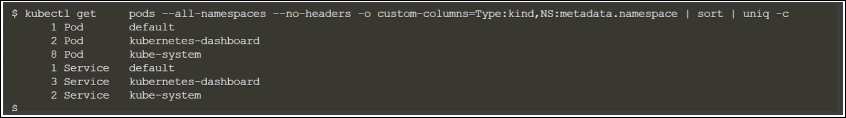
- Run the command to count the number of Kubernetes object instances present in your cluster:
kubectl get pods --all-namespaces --no-headers -o custom-columns=Type:kind,NS:metadata.namespace | sort | uniq -c
For example, the following screenshot shows the number of instances of services and pods present in the different namespaces in your cluster:
Optionally, aggregate the number of instances of the various objects, excluding the ones that you do not want to monitor to estimate the number of licenses that you need to monitor your cluster.
How are Kubernetes container resources counted?
Kubernetes resources, like cloud resources, are ephemeral resources, though Kubernetes nodes and services are more persistent or less ephemeral than pods. ‘Ephemeral’ means that a Kubernetes or cloud resource may only exist for a concise period, possibly only a few minutes. Count Kubernetes container resources the same way that LM cloud resources are counted:
- LogicMonitor polls the customer account several times a day at roughly 4-hour intervals. At each poll, a count of Kubernetes resources in the account is captured at that specific time. At the end of the day, a daily average from the polls is calculated.
- Based on the daily average, monthly billing is calculated. So pods that might spin up and down between polls in essence are complimentary. They are not counted, but LogicMonitor still retains the data for the resource that is mentioned in the customer’s SLA for the license.
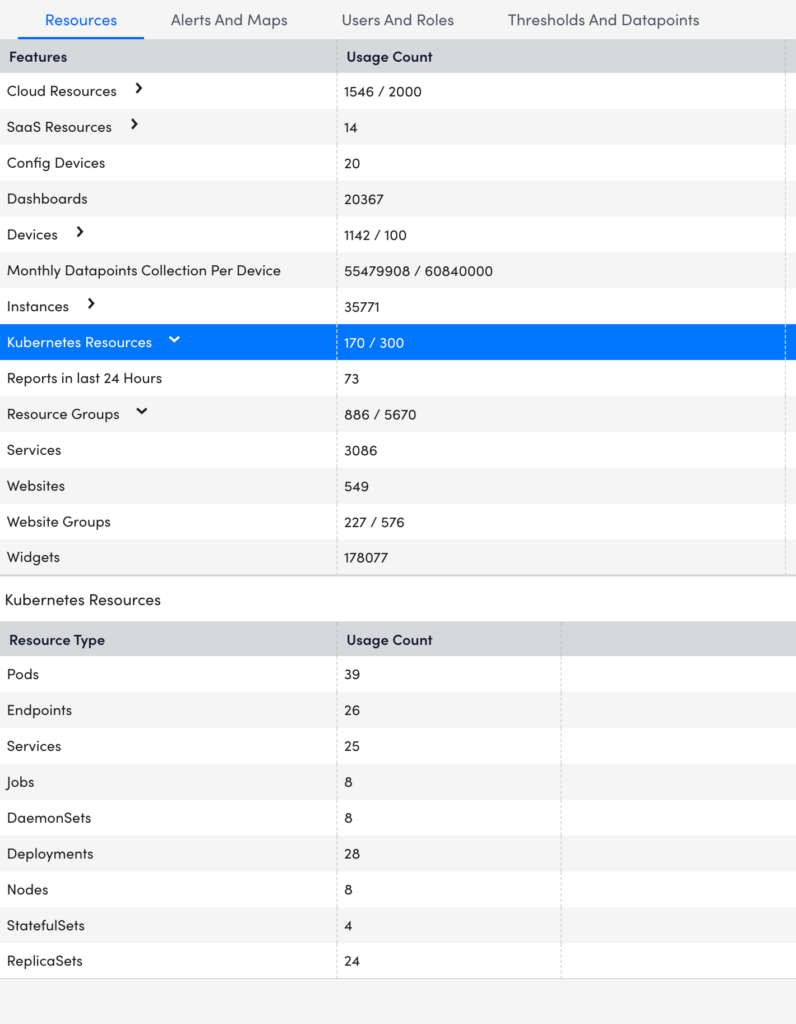
When a poll is taken or whenever a user looks at their portal, the most current Kubernetes resource count is displayed in the Account Information table within LogicMonitor.
Following is the example of the count for the Kubernetes resources:
Where can I find the license information?
For license information, contact your Customer Success Manager (CSM).
What is the pricing for Kubernetes Container Monitoring?
Kubernetes monitoring capability is available as an add-on across all licenses (Starter, Enterprise, SP Enterprise). The add-on feature is called ‘LM Container’. Users are charged per Kubernetes Pod only. This makes it easier for you to count fewer resource types and calculate the number of licenses required to monitor your Kubernetes clusters. LogicMonitor can monitor a variety of Kubernetes objects. For more information on a comprehensive list, see Supported Resources.
Note: Users on legacy SKU will continue to be charged for individual Kubernetes objects, such as Services, Deployments, Pods, and Nodes, until you migrate to the new pricing structure.
- The number of licenses used is determined by the number of Pods monitored per day averaged over the month.
- We recommend contacting your Customer Success Manager with a license purchase request if your infrastructure exceeds your committed licenses. This ensures that your costs grow predictably.
Resource Units for Kubernetes
| Service | Category | Resource Unit | Billable As |
| LM Container | Compute | Kubernetes Pod | PaaS |
