
Troubleshooting NetFlow Monitoring Operations
Last updated – 24 July, 2025
Overview
LogicMonitor offers several troubleshooting tools to help you identify and resolve issues with LogicMonitor’s monitoring of network traffic flow data.
NetFlow Health Widget
For an at-a-glance view of the health of your network traffic flow monitoring operations, LogicMonitor offers the NetFlow Health widget. Available from the Traffic tab at the device level, this widget brings key performance indicators (KPIs) front and center for fast troubleshooting and issue resolution.
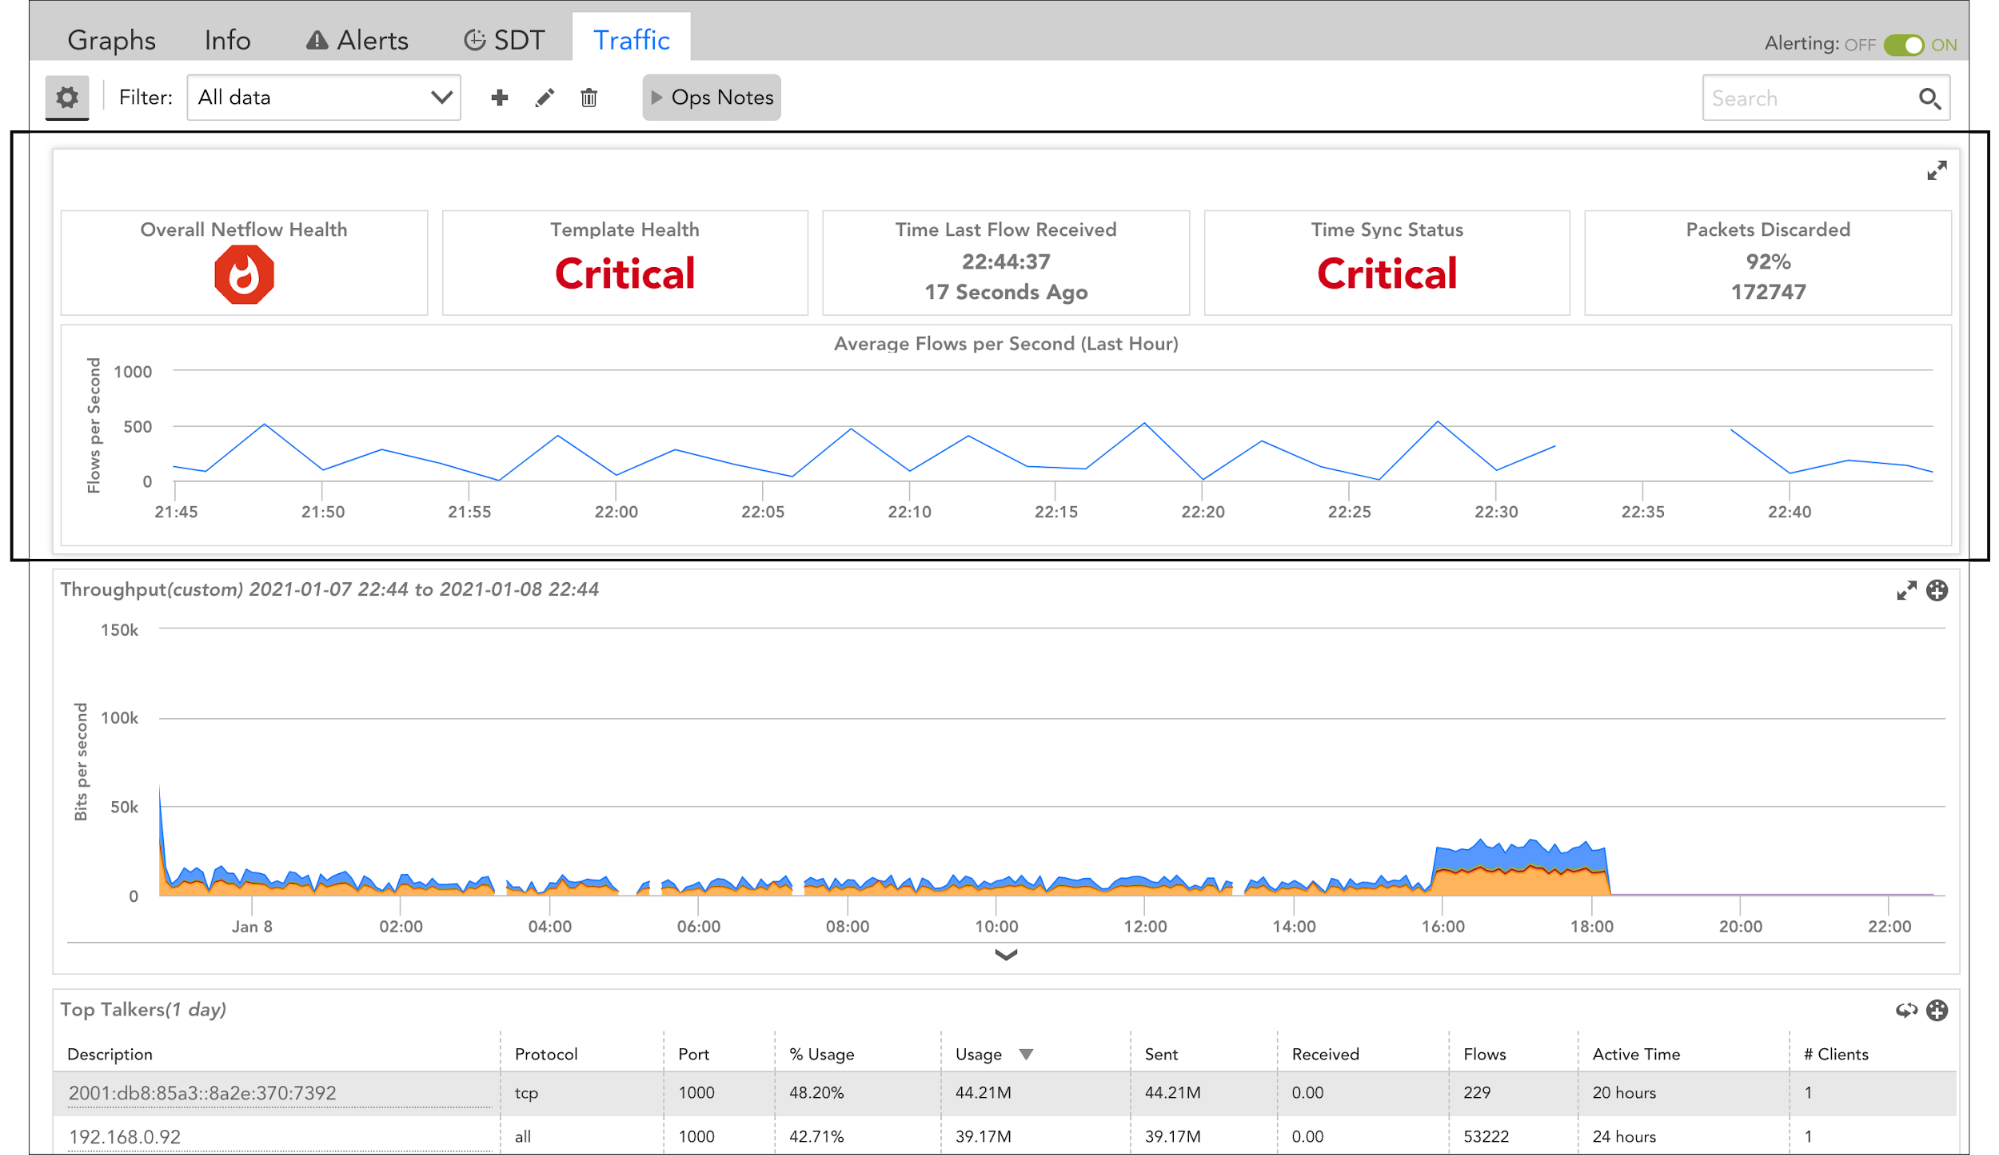
Note: The NetFlow Health widget UI is refreshed every five minutes.
Note: The Collector assigned to monitoring network traffic flow data for the device must be Collector version 30.100 or higher.
Each card featured on the NetFlow Health widget is detailed next.
| Card | KPI Description | Severity Levels |
 | Reflects the highest level of issue severity that bubbles up from any of the KPIs monitored by the other cards. |
|
 | Reports on template health according to the time elapsed since a NetFlow version 9 template was received. Typically, devices send templates every five minutes. |
|
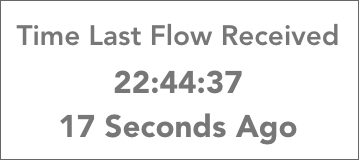 | Displays the time at which (and time elapsed since) the most recent flow datagram was received from the device. | Although this card does not explicitly display an associated severity level, the thresholds associated with it contribute to the severity level displayed by the Overall NetFlow Health card.
|
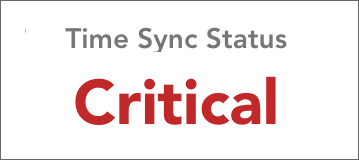 | Interprets condition of time synchronization status between the clock on the device and the clock on the Collector host. |
|
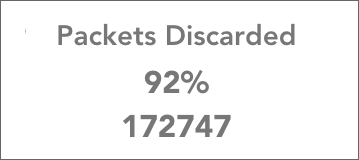 | Displays the number and percentage of packets discarded by the NetFlow Collector over the past hour. | Although this card does not explicitly display an associated severity level, the thresholds associated with it contribute to the severity level displayed by the Overall NetFlow Health card.
|
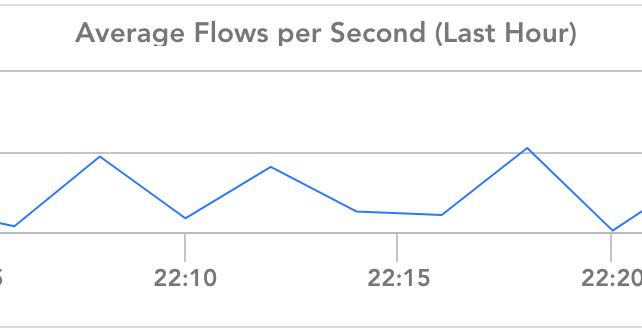 | Graphs the average number of flows per second that were received over the last hour. | N/A. This card displays data only; it does not assign severity nor do its metrics contribute to the Overall NetFlow Health card status. However, as discussed in the NetFlow DataSources section of this support article, you can configure LogicMonitor to alert on this data via the LogicMonitor_Collector_NetflowMetrics DataSource. |
NetFlow DataSources
LogicMonitor has two built-in DataSources that monitor NetFlow conditions. These DataSources track information valuable to troubleshooting and can be configured to alert you to potential issues with the metrics they monitor.
Note: The DataSources discussed next both contribute to the metrics displayed by the NetFlow Health widget; however, you may notice time discrepancies when viewing data at the DataSource level as compared to viewing data presented in the widget’s UI as the interval at which data is collected by the DataSources differs from the interval at which the widget UI is refreshed (every five minutes).
Netflow_Device_Heartbeat DataSource
The NetFlow_Device_Heartbeat DataSource calculates the time elapsed since the most recent flow datagram was received by the Collector from the device. This DataSource automatically associates with any devices for which network traffic flow monitoring has been enabled via the Enable Network Flow Analysis checkbox (this checkbox controls the value of the system.enablenetflow property).
Because the idle interval conditions are site specific, this DataSource currently has no default alert thresholds assigned. If you would like to receive alerts when elapsed time exceeds designated thresholds, you may manually assign alert thresholds to the idleInterval datapoint. See Tuning Static Thresholds for Datapoints for more information on assigning thresholds.
LogicMonitor_Collector_NetflowMetrics DataSource
The LogicMonitor_Collector_NetflowMetrics DataSource monitors a Collector’s NetFlow processing metrics such as average flows per second, processing time, and success or failure of packet processing. This DataSource is part of a suite of DataSources designed to monitor various Collector metrics.
This DataSource automatically associates with any Collector devices. As with the NetFlow_Device_Heartbeat DataSource, you must manually set datapoint thresholds if you would like to be alerted of any conditions monitored by this DataSource.
Debug Commands
The Collector Debug Facility can be used to remotely run NetFlow debug commands on your Collector.
| Command/Function | Description |
| !netflow func=listDevices | Lists current NetFlow enabled devices (ID, name, IP address, interfaces). |
| !netflow func=query select * from raw<deviceId> | Queries table of raw flow data. |
| !netflow func=diagnose <deviceId> [timezone] | Checks clock synchronization between the clock on the device and the clock on the Collector host. |
| !netflow func=dump <deviceId> | Tracks flows failed with exception message including template mismatch, missing mandatory fields, and so on. |
| !netflow func=debug log no|all|error | Updates logging level for NetFlow activities. |
| !netflow func=getWaitAggregateTables | Lists tables currently waiting for 5-minute aggregation. |
| !netflow func=getActiveTables
| Lists current active tables into which flows are being inserted. |
| !netflow func=getDatasize | Returns size of HSQLDB file. |
| !netflow func=getFlowMetrics | Returns count of total raw flows, total flows by protocol, and total aggregated flows. |
Common Issues
Next, we have identified several issues, along with troubleshooting steps, to help you resolve common network traffic flow monitoring issues that may arise.
Issue: No traffic data
- Ensure network traffic flow is enabled in device management
- Ensure your device is configured to send to the correct Collector and that the port is not blocked by a firewall
- Ensure the time between the Collector and the device is synced
- Run a packet capture to see if cflow packets are reaching the interface of the Collector host
Issue: Missing traffic on specific interfaces
- In LogicMonitor, ensure the interface is being monitored by a datasource name starting with “snmp64_if” or named SNMP_Network_Interfaces.
- In the Collector Debug Facility, run
!netflow func=listDevicesto ensure the interface index is listed - Run a packet capture on the Collector host with the filter set to
cflow.inputint == 1(where 1 is the index of the interface in question) to see if any flows are being sent to the Collector
Issue: No egress traffic
- Run a packet capture on the Collector host with the filter set to
cflow.direction == 1; if no packets are seen, check the device to ensure it is configured to provide egress
Issue: No NBAR2 data
- Ensure the device config is not missing the collect application setting from the flow record (Cisco)
- Ensure the device config is not missing the option application-table setting from the flow exporter (Cisco)
Issue: NBAR2 data is missing category data
- Ensure the device config is not missing the option application-attributes from the flow exporter (Cisco)
Issue: Inconsistent UDP port configuration
- Verify that the UDP port(s) specified on the device match the UDP port(s) specified on the Collector (as set by the netflow.ports configuration).
Issue: Blocked/firewalled UDP port
- Many UDP ports are automatically blocked by Windows firewalls or Linux iptables. On the Collector host, create an exception for the configured UDP port on inbound traffic to allow network traffic flow data to reach the LogicMonitor application. If there is a firewall or ACL between the device and the Collector, verify that the traffic for your configured UDP port is allowed.
Issue: Clock non-synchronization
- As previously stated, it is crucial for the clock on the network device to be synchronized with the clock on the Collector. If the device clock is ahead or behind the Collector clock, flows may be discarded. The
!netflow func=diagnose [timezone]debug command can be used to verify clock synchronization. Additionally, LogicMonitor displays the Collector timestamp for the most recent flow update (LastData ReceiveTime), as well as the device timestamp for the exported flow (Timestamp In Last RawData). If these values are off by more than a minute, clock synchronization is the likely problem. It is highly recommended to use NTP to automatically synchronize the clocks to a standard and consistent time and timezone.
Issue: inconsistent flow data or misaligned data (Cisco ASA)
- Cisco ASA devices only support NetFlow version 9. NetFlow export on the ASA platform is event driven (unlike a Cisco routing platform, the Cisco ASA does not send incremental updates). NSEL records are only sent during flow creation, teardown, or ACL deny events. Cisco ASA devices will not populate the ToS bits or the TCP flags.
