
Application Topology Table
Last updated - 10 November, 2025
Selecting each service on the topology map displays information on which namespace it belongs to, a list of spans, associated alerts and logs. All this information displays in a tabular format below the topology map based on the selected service.
Note: There are some service nodes which appear in the topology map but when selected do not display data due to inadequate permissions.
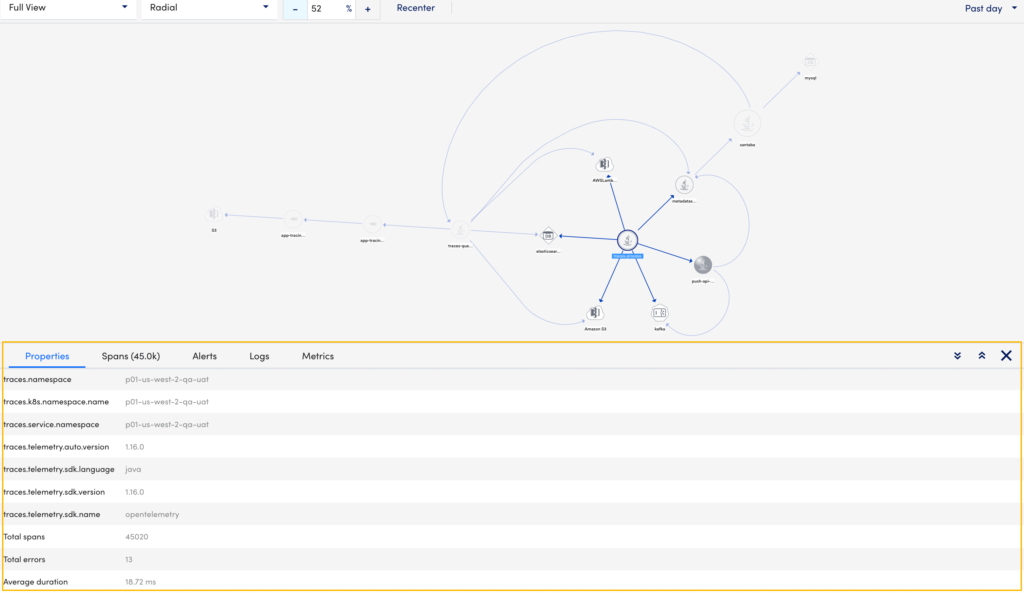
The application topology table displays the following details:
| Tab | Description |
| Properties | Displays the following information about the service:
|
| Spans | Displays all the spans information based on the time range selected in the sort data by time range option. This includes the service operation name, duration of the span, namespace or application name to which the service belongs, service name, and resource id. Note: You can select |
| Alerts | Displays all the alerts for the selected service. This includes information like severity, alert rules, instance, datapoint, escalation rule. For more information on alerts, see Managing Alerts from the Alerts page. Note:
|
| Logs | Displays all the relevant logs for the selected service. This includes the time, severity, and message for the selected service. |
| Metrics | Displays the metrics (Duration, OperationCount, ErrorOperationCount) of the operations associated to the service in a graph. The metrics displays for a time range (+/- 15 minutes) of the ingested span. You can zoom in on each graph. |
