Viewing Config Files from the Resources Page
Last updated - 24 July, 2025
Configs Tab Overview
If configuration file monitoring is established for a resource, the config files are viewable as instances within the Resources tree underneath their associated device.
Note: If the ability to monitor and alert on configuration files is not currently available in your LogicMonitor platform and you would like to learn more, reach out to your customer success manager.
Once a ConfigSource is highlighted from the Resources tree, you can view your config versions by opening the Configs tab.
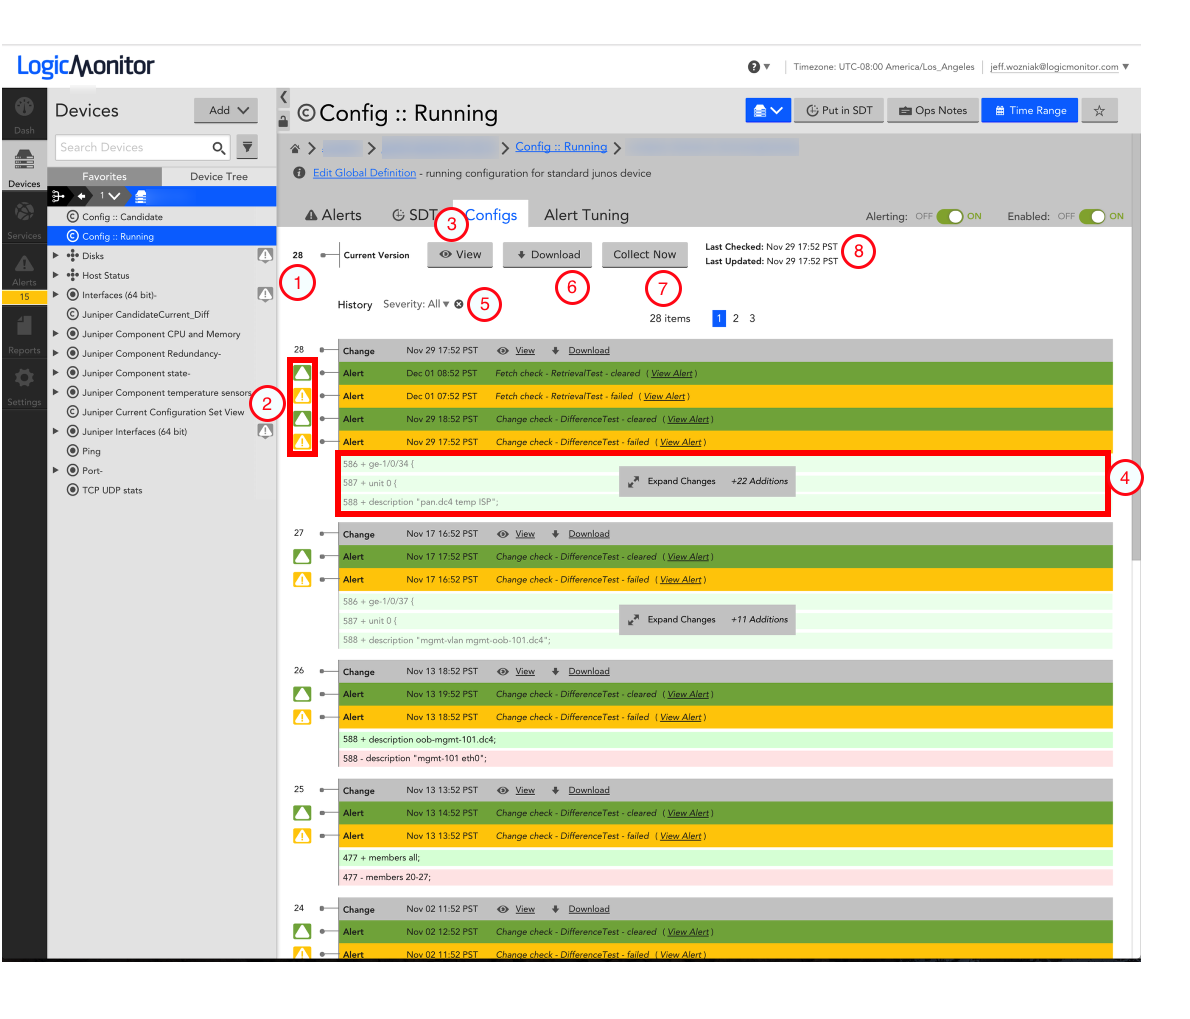
Use the following guide to navigate the config’s changes and alerts displayed in this tab:
- Config Version: The numbers displayed in the left margin of your configuration file indicate the config’s version. LogicMonitor will only store a new version of your config file when a change is detected from the prior version.
- Alerts: alerts are represented by an alert icon displayed to the left of your configuration file as well as by a color-coded row embedded above the config version on which the alert was triggered. Alert color coding is consistent with the rest of the LogicMonitor UI: red = critical, yellow = warning, orange = error, and green = alert cleared.
- View: Selecting the eye icon will open a new window in which your full configuration file will be displayed. This window will also allow you to compare config versions side-by-side to easily identify changes.
- This boxed portion will display the changes made in the corresponding version of your config file (version 28 in the example below). Green-highlighted lines are the updated version of your config while red-highlighted lines are the prior version. To view all the changes made to this config’s version select the “expand changes” box.
- You can filter the config file’s version history based on alert severity. For instance, selecting “Severity: Warning” will only display warning-level alerts and the associated config changes that triggered those alerts.
- Download the full current config version to your device.
- Collect Now: Selecting this button will run the ConfigSource against this config file to check for updates/changes.
- Last Checked vs. Last Updated: This displays the timestamps for the last time this config file was checked and the last time it was updated. “Last Checked” will display the last time your config file was evaluated for any changes. “Last Updated” indicates the last time a change was actually detected and the config version was updated, accordingly. Please note the date listed on the config file reflects the date a change was detected and the file was updated.
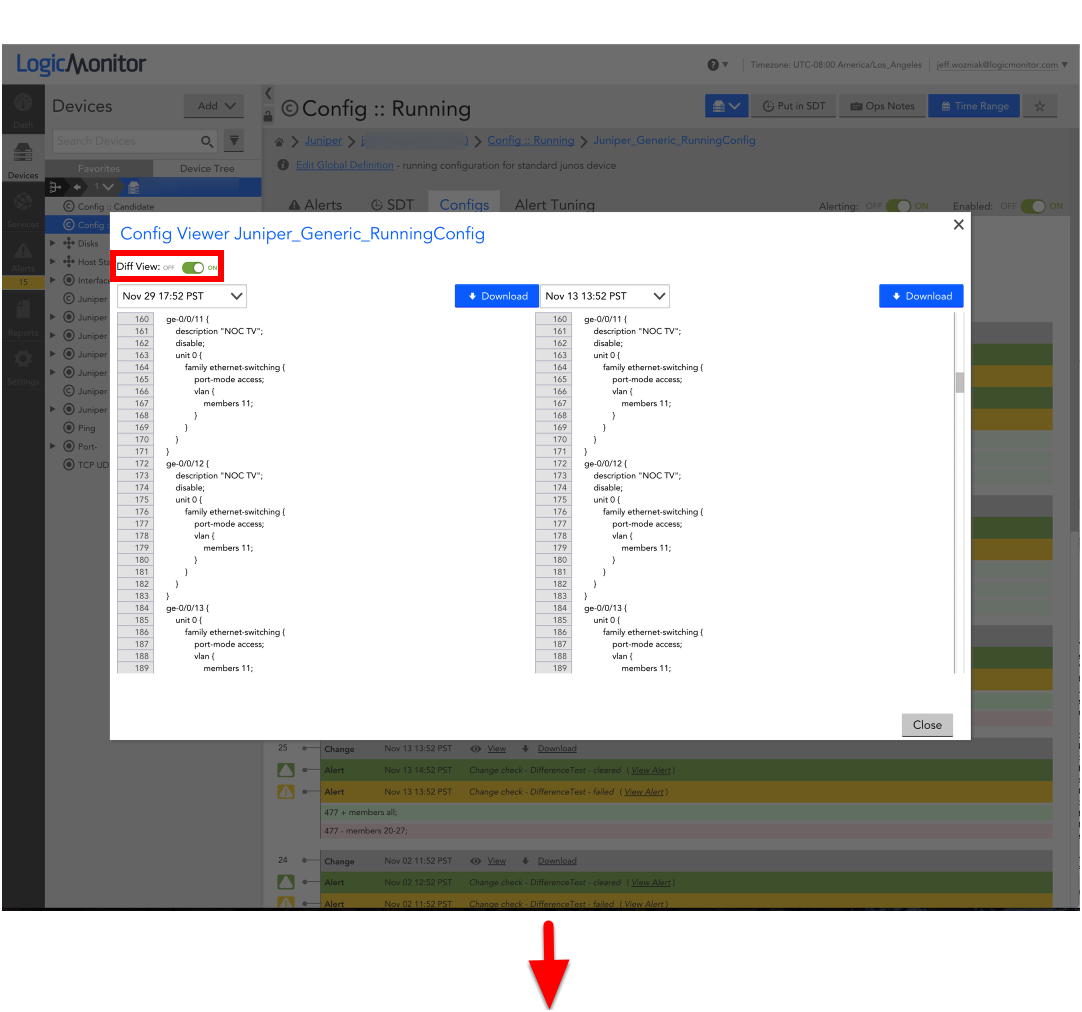
Diff view
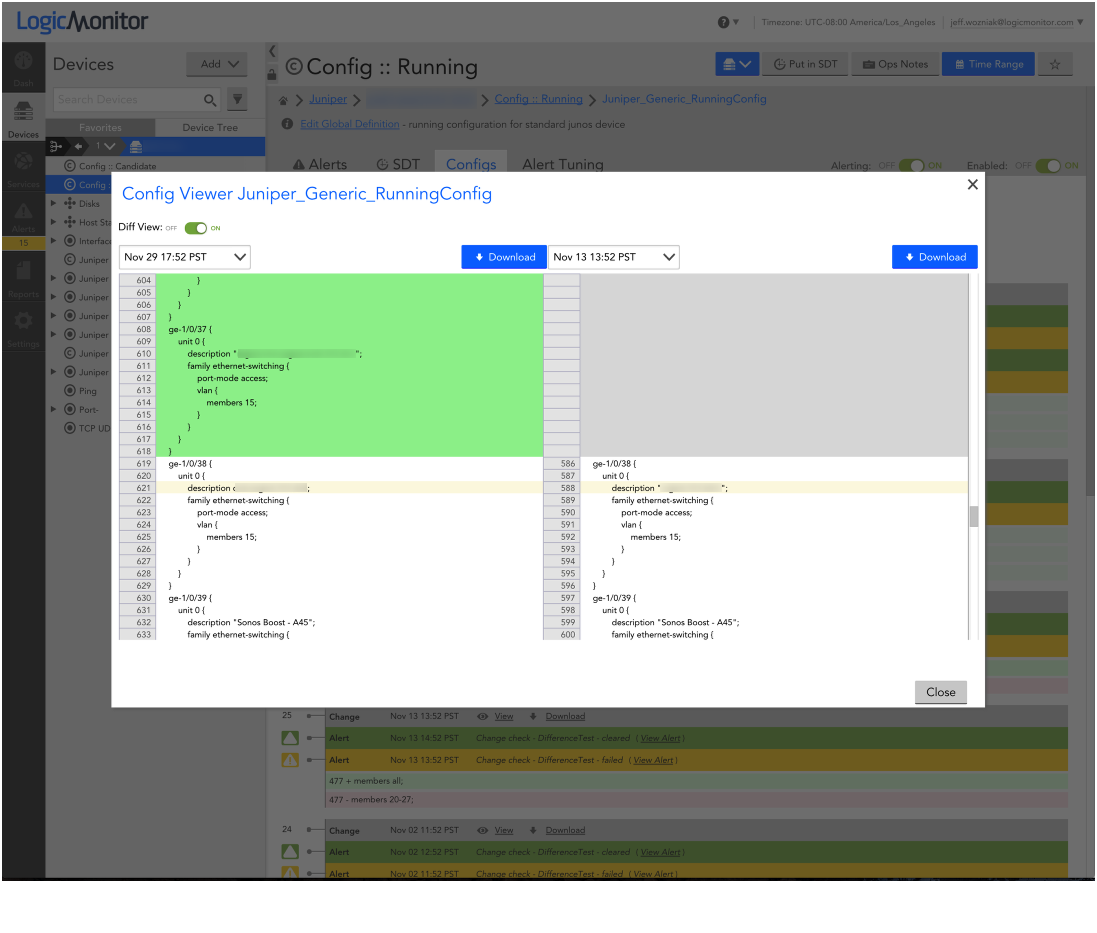
Clicking “View” will display your full configuration file.
Selecting the Diff View toggle “ON” will display a side-by-side comparison of your config’s versions. Diff View will default to compare your current config with the version collected immediately prior. However, you can manually select the versions you would like to compare by changing the timestamp field, which shows the timestamps of all your saved config versions.
Changes to the config files are highlight in red, green, or yellow. Red indicates a portion of the config file which was removed in the more recent of the two versions. Green indicates a portion of the config file which was added to the more recent of the two versions. Yellow indicates a portion of the config file that was simply modified.
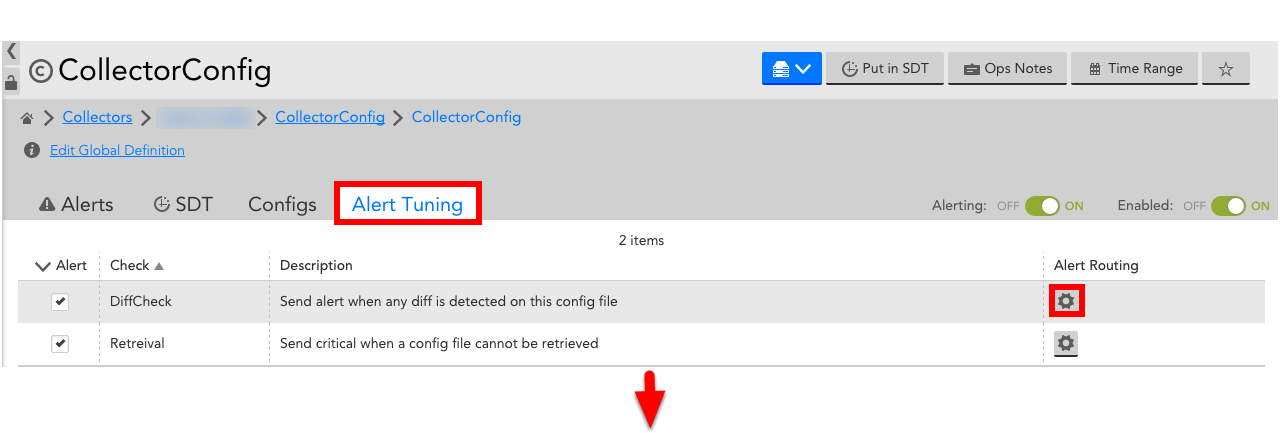
Alert Tuning
Embedded in the Config instance-level view is an Alert Tuning tab from which you can view the config file’s relevant ConfigChecks as well as their associated alert routing.
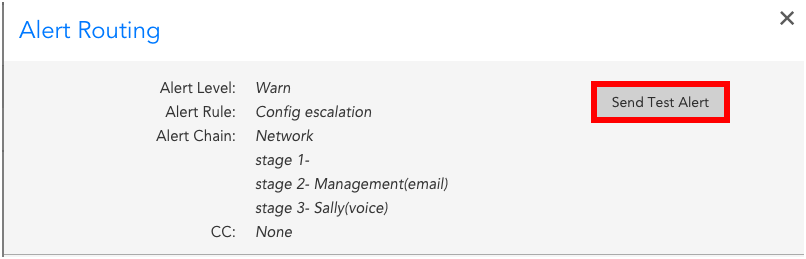
As a best practice, it is recommended that you send test alerts to verify that your ConfigChecks are properly aligned with an Alert Rule and Escalation Chain, thus ensuring that an alert notification is sent to the correct individual(s).
You can do this by selecting the “manage” icon under the “Alert Routing” column and clicking “Send Test Alert.” The Alert Routing window will display all relevant information pertaining to the ConfigCheck’s alert, including Alert Level, Rule, Chain, and alert delivery method broken-down by escalation chain stage.