


Network Monitoring Without The Gaps
Spot and solve network and internet performance issues fast before they disrupt users. Get complete visibility across your cloud, data center, websites, and edge devices in one platform.
When your team can see everything and understand what to act on, incidents shrink, networks perform optimally, and IT becomes a driver of growth.
When you can detect and resolve issues early, you avoid service disruptions, missed SLAs, and late-night fire drills. That means happier users and less stress for your team.
From cloud to websites to edge devices, get the awareness you need to make confident decisions, reduce risk, and stop problems before they spread.
Fewer escalations, faster root cause isolation, and smarter workflows mean less downtime and more time for the work that moves your business forward.
Whether you’re tracking uptime SLAs or validating availability across environments, LM Envision and Catchpoint help you show the value IT delivers with data that’s always ready.
By replacing patchwork solutions with a unified platform, you simplify day-to-day work and free your team to focus on what matters.
Show stakeholders how network performance affects user experience, revenue, and growth, so IT can lead with impact, not just uptime.
OBSERVABILITY POWERED BY LOGICMONITOR ENVISION, EDWIN AI AND CATCHPOINT
Everything you need to monitor, troubleshoot, and optimize your network end to end
LM Envision combines real-time visibility, automated discovery, and AI correlation to pinpoint issues, so you can keep users happy and your infrastructure running.
Discover and map devices without the manual work
Quickly detect and map every device in your network using scheduled discovery and dynamic topology views.
-
Auto-discover routers, switches, and firewalls Scan IP ranges on a schedule to identify new devices and apply best-practice monitoring templates automatically.
-
Visualize Layer 3 network relationships Generate live topology maps to see device connections and streamline root cause analysis.
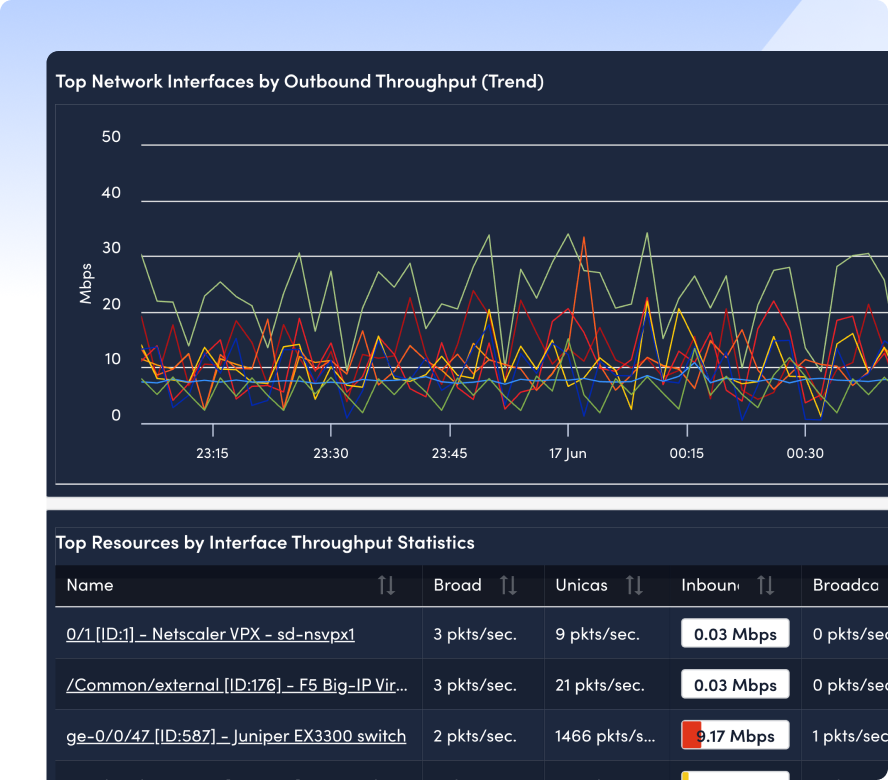
Surface real-time metrics for network and internet performance
Track performance across routers, firewalls, interfaces, and external internet paths in real time to spot issues before they impact users.
-
Monitor metrics every 30 seconds Use SNMP, WMI, or API polling for high-frequency insights into CPU, bandwidth, and latency.
-
Eliminate noise with dynamic thresholds Apply intelligent baselines that adapt to your environment to reduce false positives and highlight real problems.
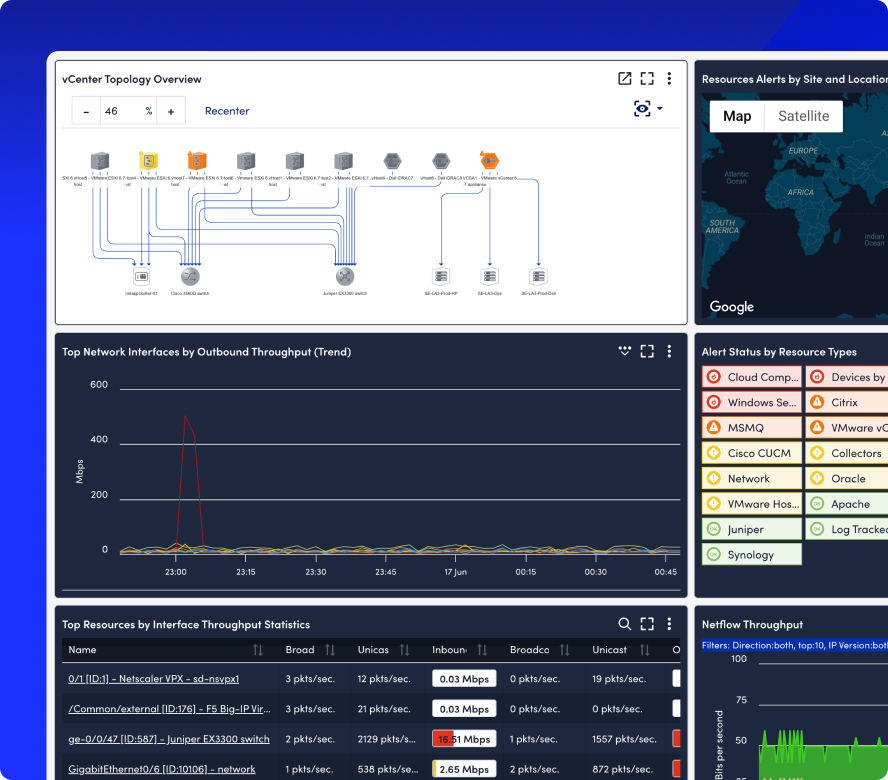
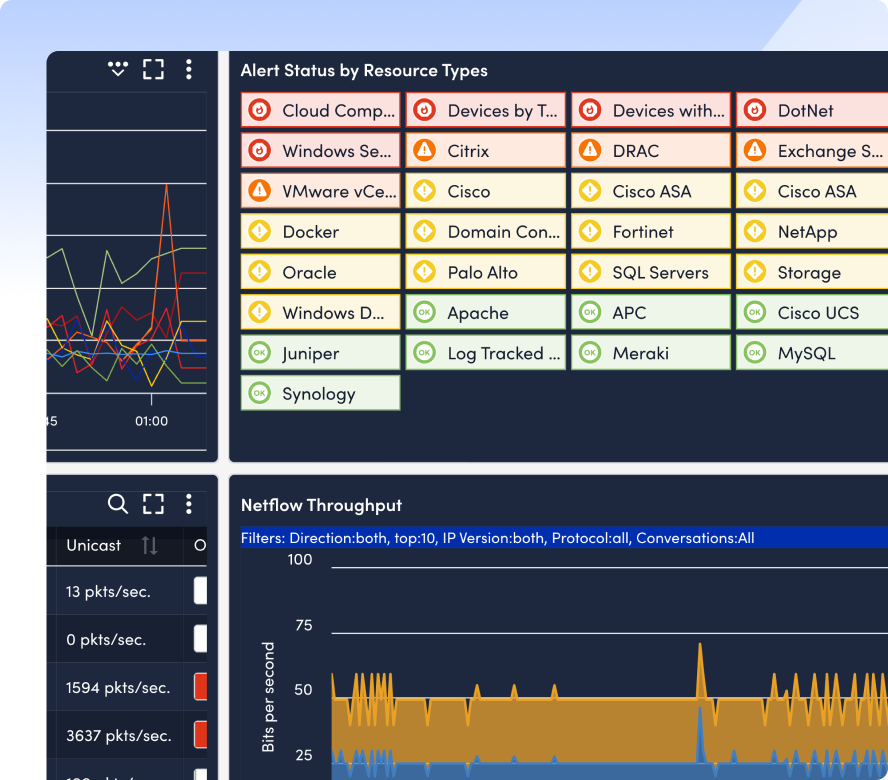
Get complete visibility into network traffic and user experience
Monitor traffic patterns across devices, apps, and protocols alongside end-user experience across the internet to identify top talkers and bandwidth hogs fast.
-
Track usage by application and protocol Instantly identify which services and devices are consuming the most bandwidth across your network.
-
Drill into flow-level traffic data and internet path performance Trace traffic by source, destination, and volume and correlate with internet path performance to pinpoint where issues occur—from your network to the end user.
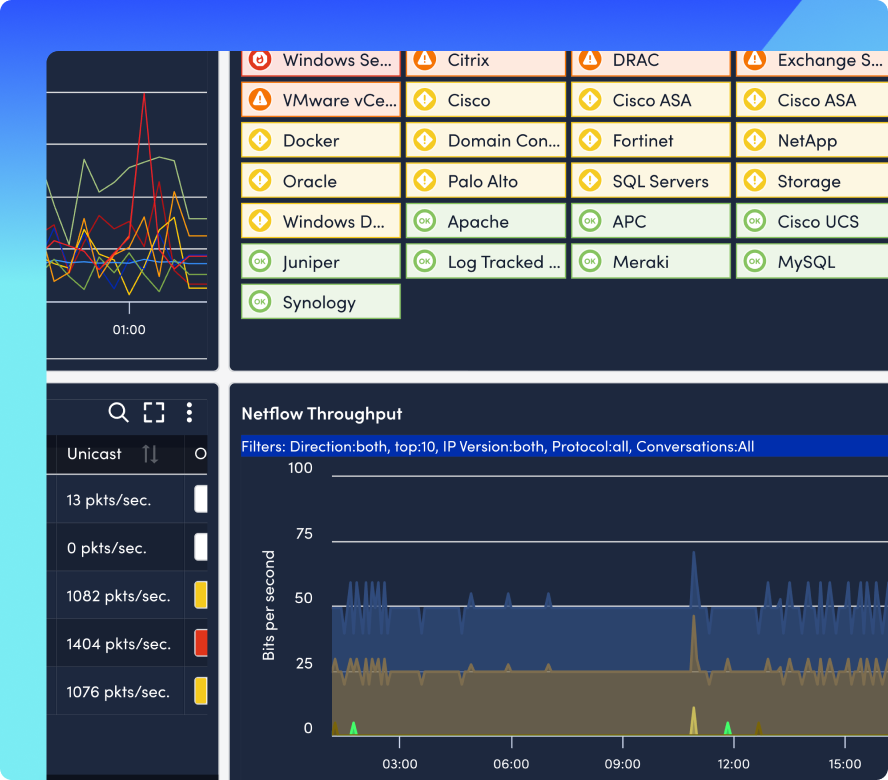
Detect anomalies and trigger smart
Use built-in machine learning to identify abnormal behavior across infrastructure and end-user experience and route alerts automatically to the right team.
-
Spot issues with predictive alerting Forecast capacity problems and performance degradation before they affect SLAs or user experience.
-
Route alerts with full-stack context Notify the right team instantly with alerts that include logs, metrics, and correlation data.
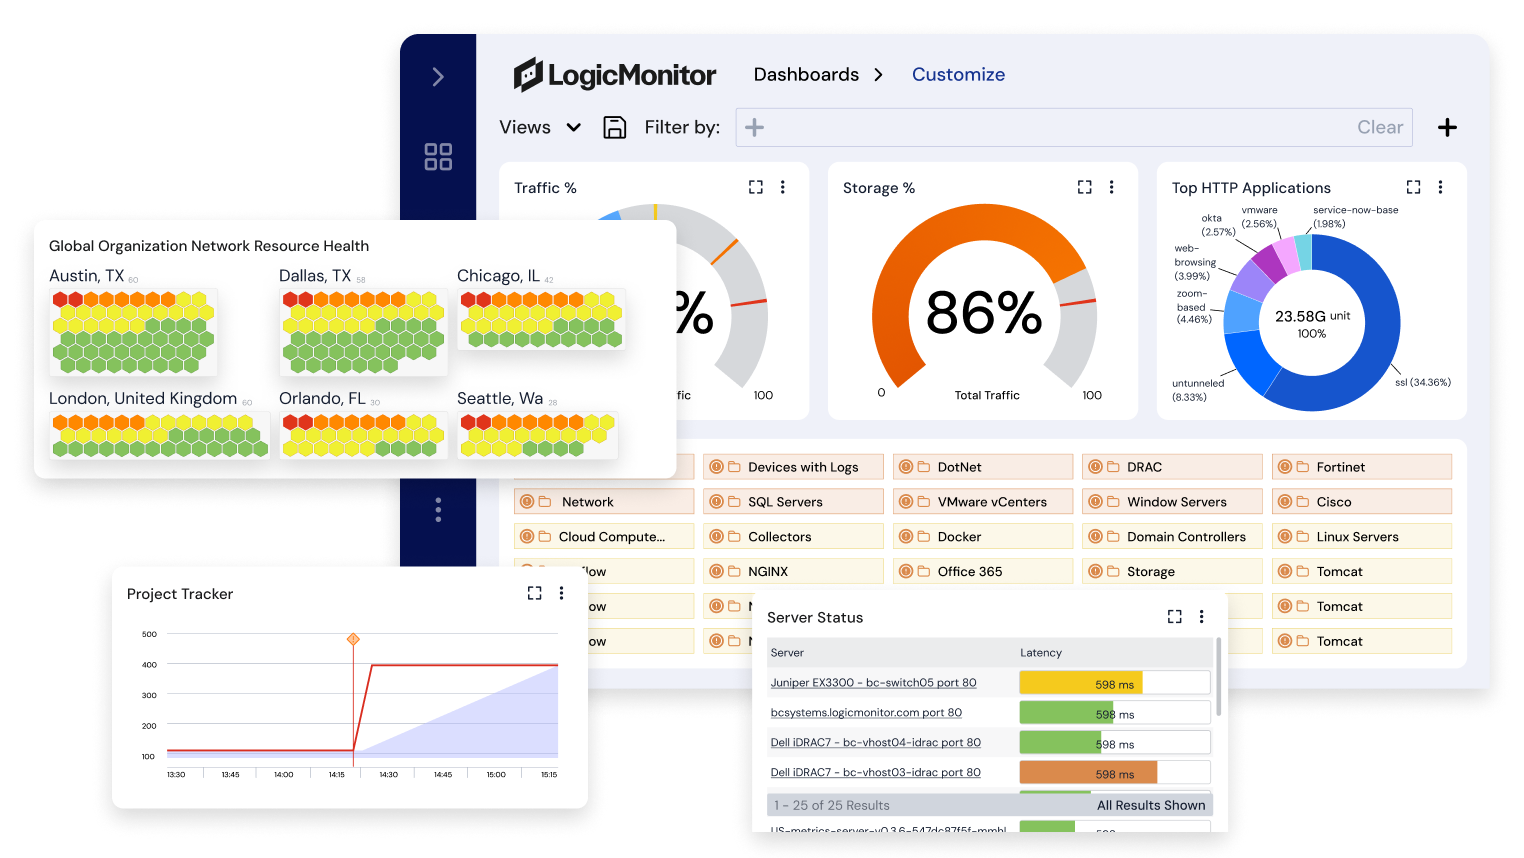
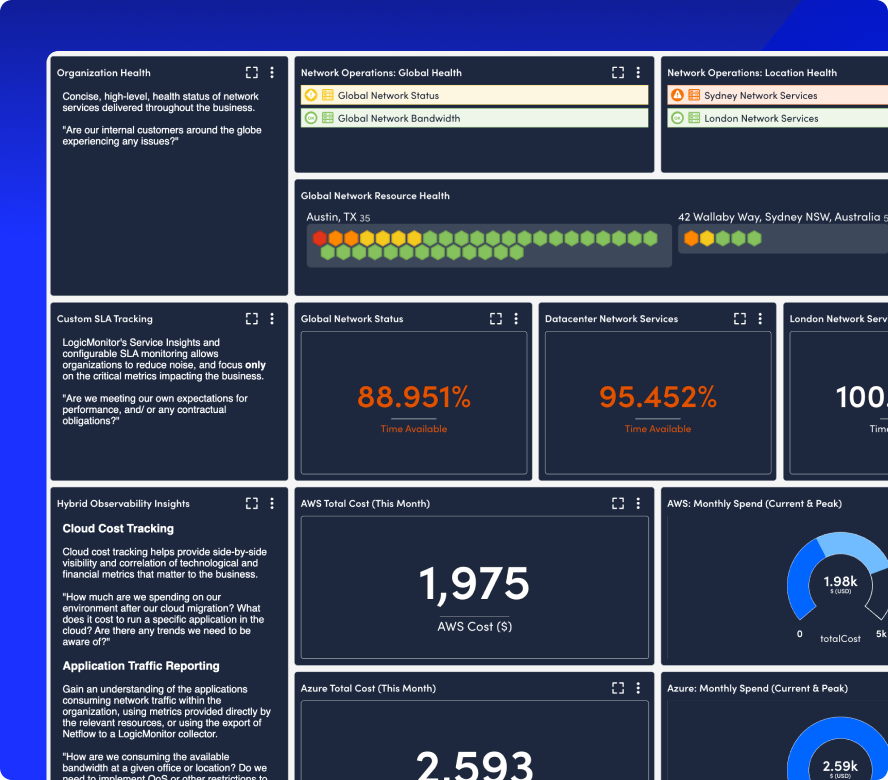
Build dashboards and reports for every team
Create custom views for operations, leadership, or customers, then automate reporting to keep everyone informed.
-
Create dashboards by role and function Customize visualizations for the NOC, execs, or external stakeholders with metrics that matter to them.
-
Send scheduled reports automatically Share recurring PDFs or CSVs with uptime, usage, and availability metrics tailored to each audience.
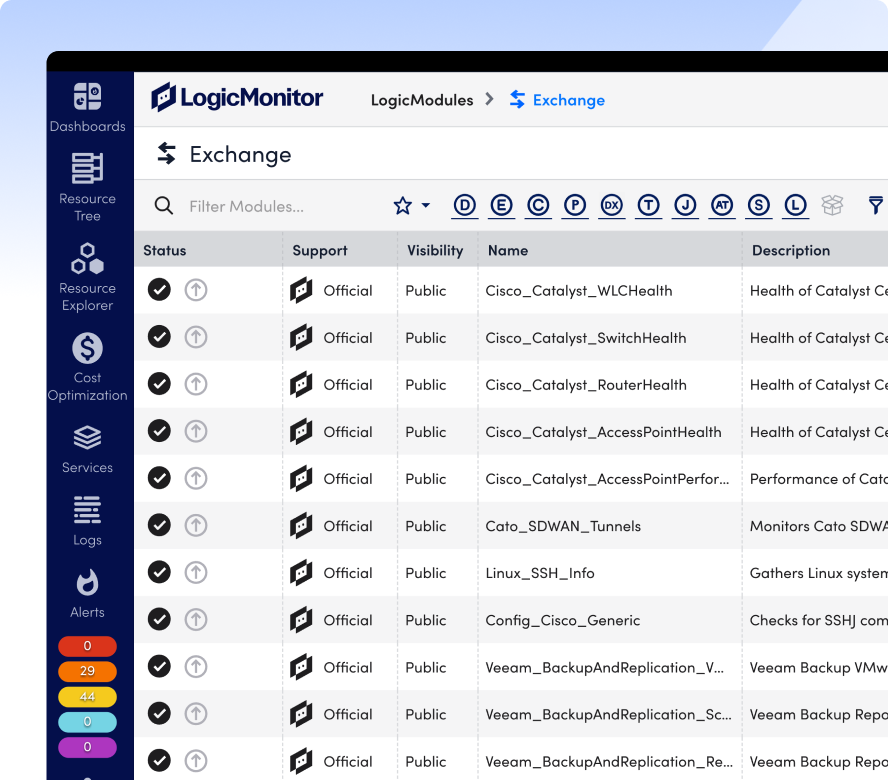
INTEGRATIONS
Works with everything that keeps you connected
Whether it’s switches, routers, firewalls, or cloud-based edge devices, LM Envision connects it all. With 3,000+ out-of-the-box integrations and full API support, you get deep insights without a heavy lift.
100%
collector-based and API-friendly
3,000+
integrations and counting
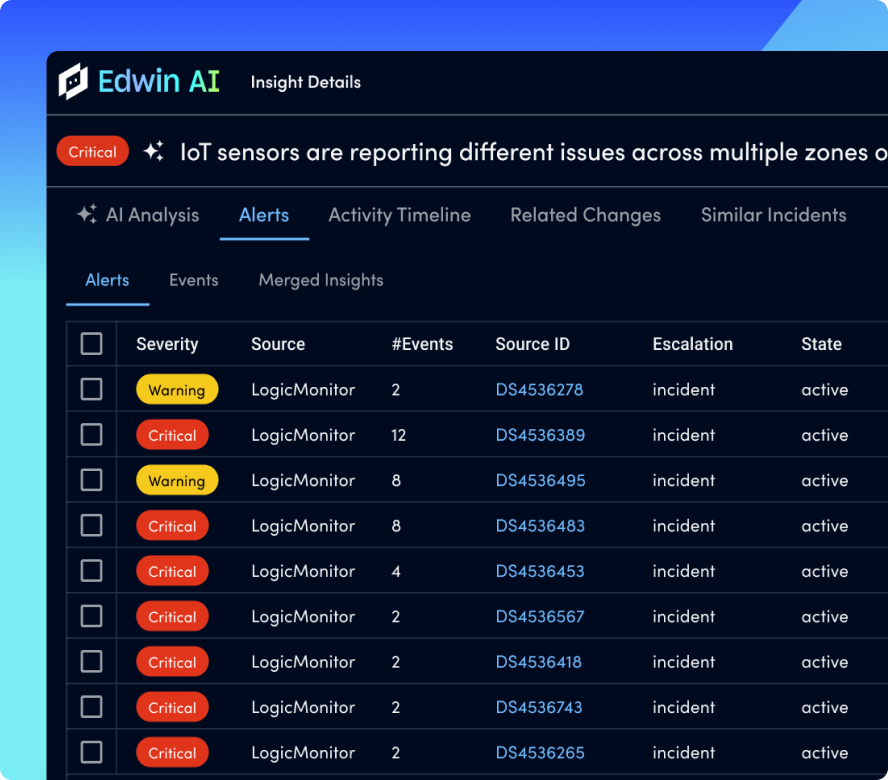
AI AGENT FOR THE NOC
Edwin AI knows what matters and what doesn’t
Edwin AI correlates logs, metrics, and topology to pinpoint root causes across your network, before users feel the impact. Just ask, and Edwin explains issues in plain language, so your team can respond instantly.
67%
ITSM incident reduction
88%
noise reduction
“Edwin AI delivered value within an hour of implementation.”
“Capital Group has 1,000+ alerts/ day. LogicMonitor will eliminate that noise.”
“LogicMonitor is a valuable partner, constantly innovating and adapting to our business needs.”
“Edwin AI is not another AI tool, but an essential part of our IT team.”
“Switching from SolarWinds to LogicMonitor showed us how much we were missing.”
“Edwin AI will be 100x faster than a human and able to manage complex problems.”
“LogicMonitor tells you what’s happening in the environment.”
“The sheer power of LogicMonitor’s monitoring capability is amazing.”
“Edwin AI cut noise by 90% & ITSM incidents by 76%, enabling better customer service.”
“The single pane of glass across all of our regions enables us to act more proactively.”
BY THE NUMBERS
Network monitoring that makes an impact
GET ANSWERS
FAQs
Get the answers to the top network monitoring questions.
Will LogicMonitor work with all my network gear?
Yes. LM Envision supports 3,000+ devices and protocols—routers, switches, firewalls, SD-WAN, and more—out of the box.
Can I share dashboards with other teams or execs?
Yes. Role-based dashboards and scheduled reports make it easy to keep NOC, leadership, and customers aligned.
How hard is it to deploy and scale?
Setup is agentless and fast. Most teams are fully up and running in hours, not weeks—with minimal configuration.
Can LogicMonitor cut down on alert noise?
Absolutely. Edwin AI and dynamic thresholds reduce false positives and prioritize what actually needs your attention.
How deep is the data visibility?
LM Envision collects high-resolution metrics every 30 seconds and correlates logs, metrics, and flow data for full context.
