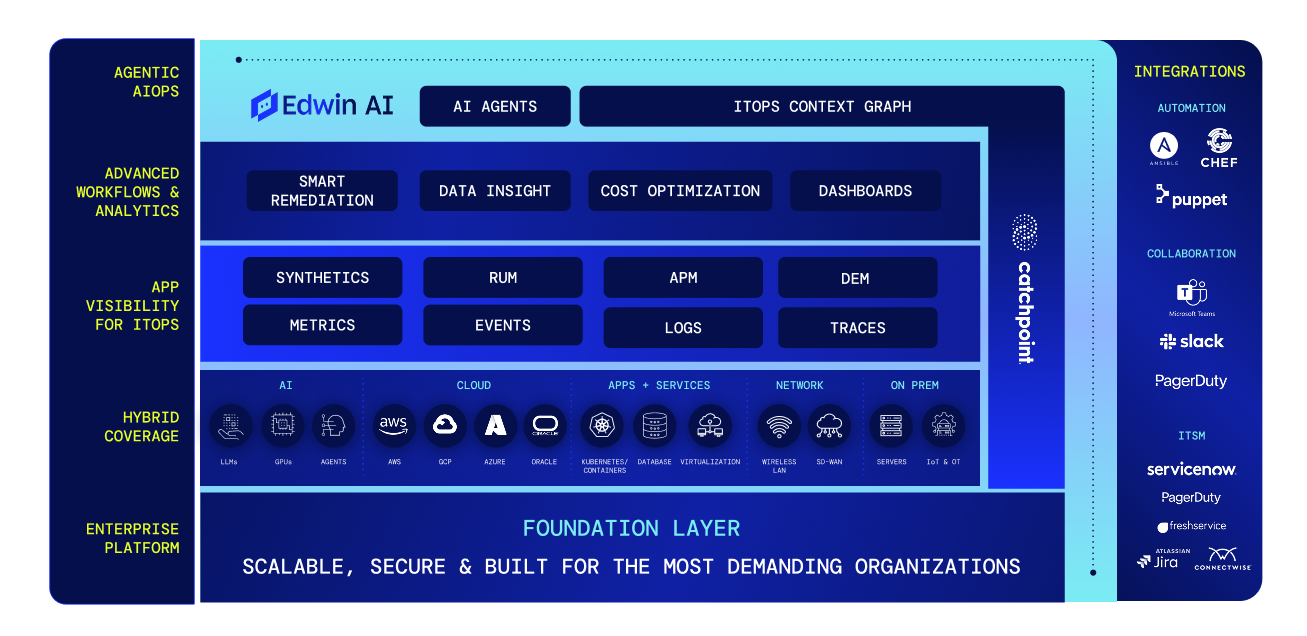

PLATFORM OVERVIEW
AI-first platform for Autonomous IT
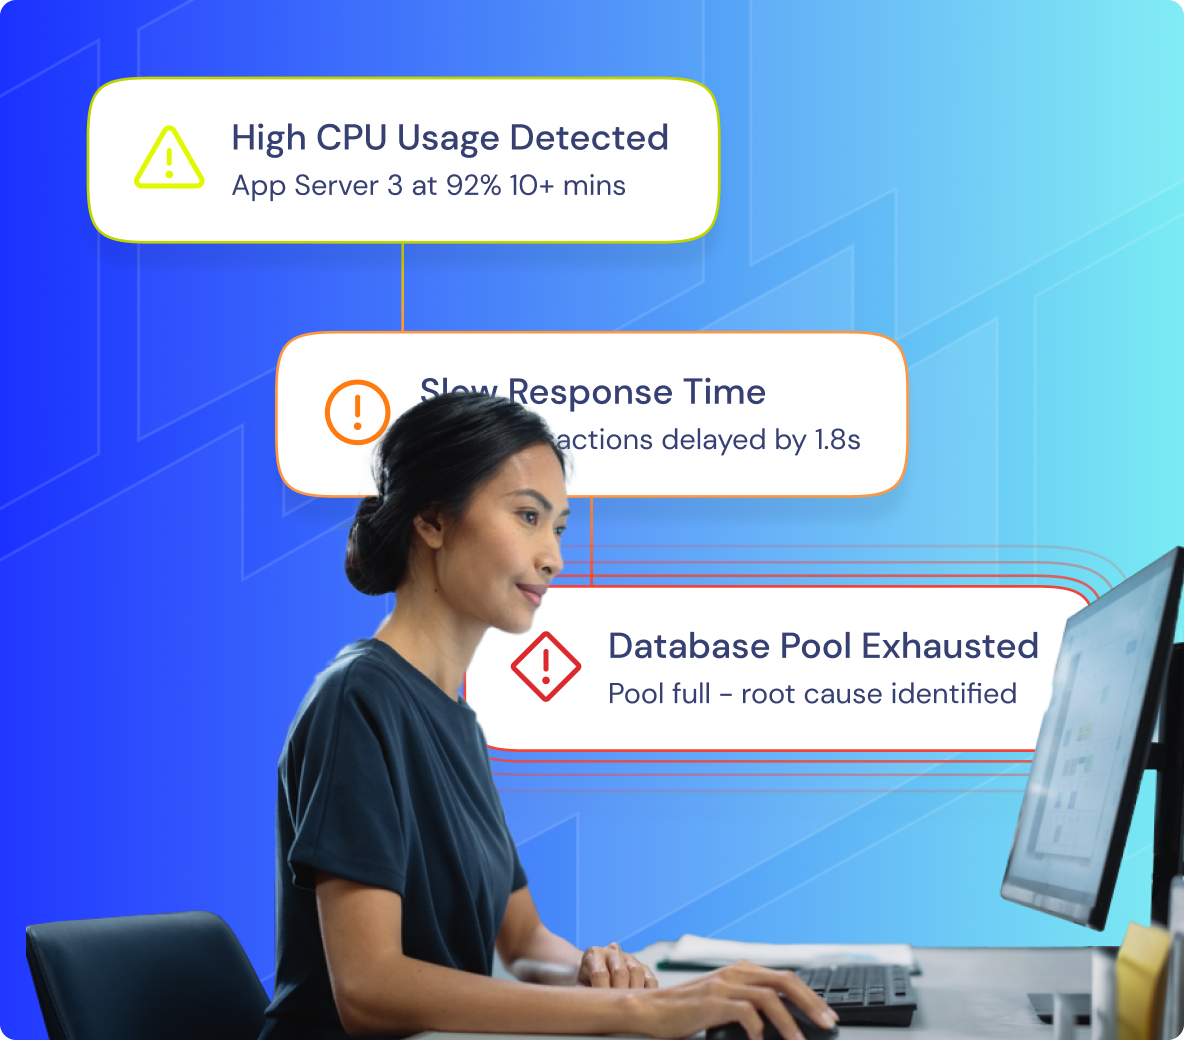
See everything in one unified view across clouds, data centers, apps, and services. LM Envision combines deep visibility with agentic AIOps to help you prevent issues before they impact the business.