More Intelligent Enterprise IT is possible

LogicMonitor provides global enterprises a path to observability in today’s complex and distributed infrastructure landscape. Now, enterprises can prevent issues before they occur and deliver a flawless end-user experience with observability for metrics, logs, and applications. Reduce IT silos in minutes by seamlessly integrating monitoring into your existing IT support processes. Learn why LogicMonitor is #1 in customer satisfaction and is a Market Leader on G2’s Enterprise Monitoring Grid.

2023 LogicMonitor badges

Unified observability with a customer-first approach

Rated #1 in support on TrustRadius and #1 in Customer Satisfaction on G2. We provide 24×7 live support with real technical engineers in your region that work as an extension of your team, enabling rapid results and providing a clear path to digital transformation.

Third-Party Report

See how LogicMonitor stacks up

LogicMonitor is a clear leader in customer satisfaction as voted by your peers. See why we lead in the 2023 G2 Enterprise Monitoring Report.

G2 2023 Enterprise Monitoring report

Enterprise observability for all your Ops

ITOps

Maximize your efficiency with your entire infrastructure at your fingertips.

DevOps

Accelerate troubleshooting with fearless deployments and more innovation.

CloudOps

Visibility and insight into all your cloud environments in one place.

Trusted by over 2000 global enterprises

Schneider Electric consolidates monitoring tools by 83% with LogicMonitor

Schneider Electric consolidated its monitoring tools by 83% after onboarding LogicMonitor’s observability platform. Schneider Electric, one of the most sustainable companies on the planet, is always striving to make energy better. This is done with the help of unified observability.

View Case Study
Schneider Electric consolidates monitoring tools by 83% with LogicMonitor

Sogeti Improves Digital Agility and Reduces Customer Monitoring Onboarding Time by 90%

With LogicMonitor, Sogeti reduces tool sprawl, onboards customers 90% faster, and increases automation. See how!

View Case Study
Sogeti: Part of Capgemini logo

LogicMonitor helps Bandwidth increase their time to develop by 80%

Austin Culbertson, NetOps Observability Manager at Bandwidth, talks about his organization’s progress toward unified observability and the important role operational efficiency plays in their strategy.

View Case Study
Bandwidth makes strides with operational efficiency

CCI Systems Connects Hotel Guests using LogicMonitor Platform

LogicMonitor provides consistent high-speed Wi-Fi for hotels and multiple dwelling units 

View Article
CCI Systems case study logo
Availability dashboard

With LogicMonitor, you get:

  • Unified observability for infrastructure, logs, and applications within a single platform
  • Automatic agentless discovery, deployment, and configuration for over 2000 technologies
  • Two years of data retention and 24×7 technical support
  • Detection and analyzation of anomalies with rapidly surfacing actionable insights
  • Intelligent metrics, robust alerting, and dynamic topology mapping
  • Advanced AIOps features including root cause analysis, anomaly detection, and forecasting

Five reasons enterprises choose LogicMonitor

Rapid and automatic

Get the answers you need to solve problems faster with LogicMonitor’s fully automated platform. Our agentless collectors automatically discover, map, and set baselines for complex and distributed infrastructure in a matter of minutes. Put the manual configuration and expensive hardware behind you with monitoring built for the modern age.

A single source of observability

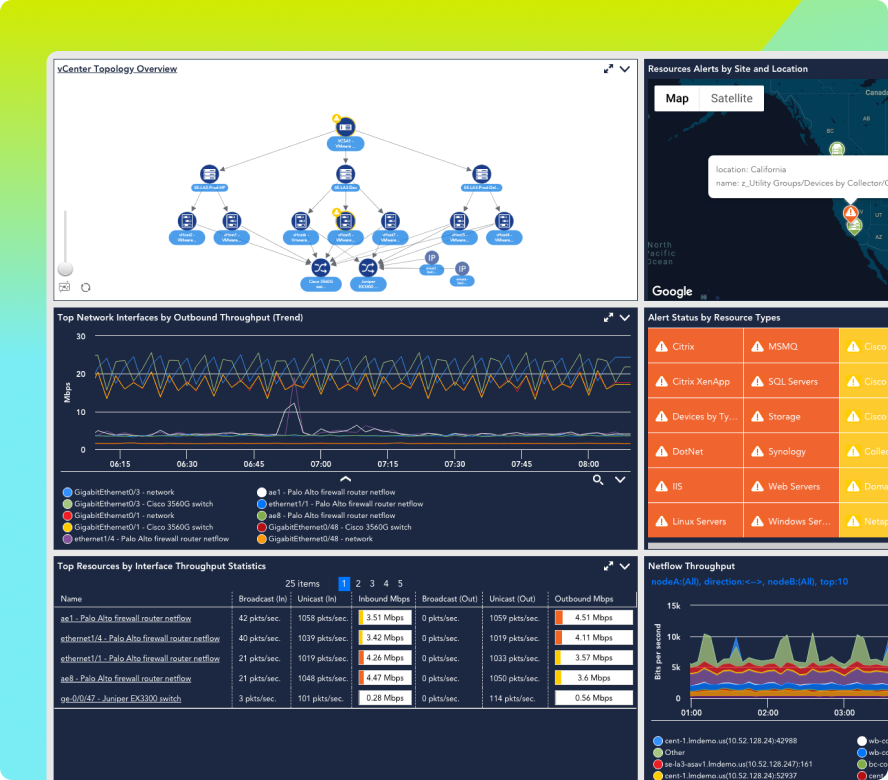
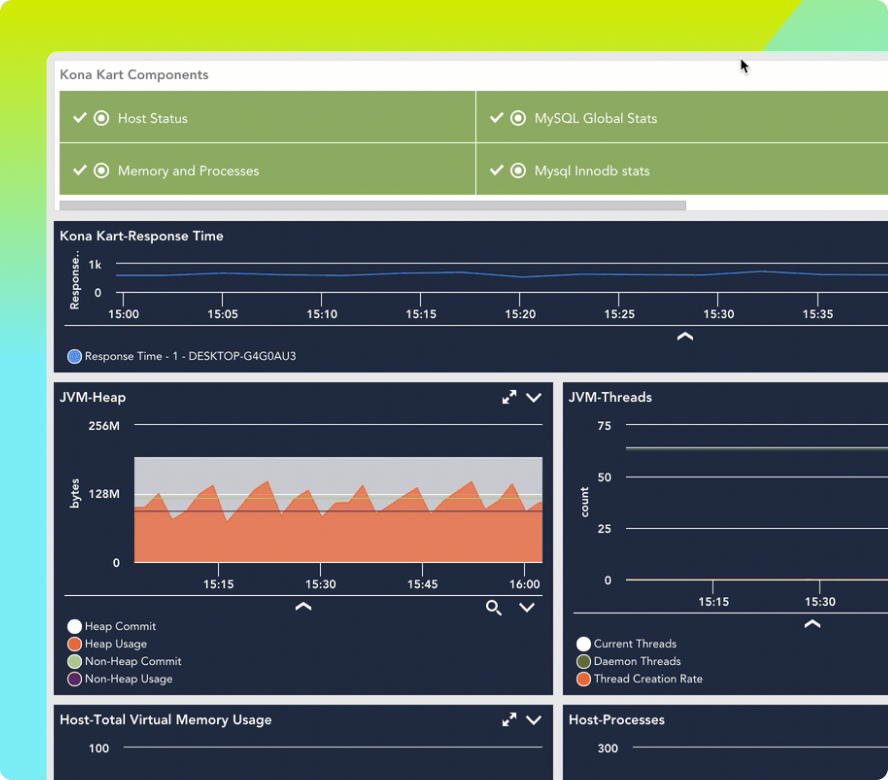
Reduce tool sprawl and unify teams with contextual insights that span infrastructure, applications, and logs in a single platform. LogicMonitor’s AI-based platform goes beyond data to give you actionable insights for your entire tech stack.

Ensure flawless user experience with website monitoring and synthetics. Monitor the availability and performance of complex dispersed infrastructure – anywhere in the world.

Gain visibility over multi-cloud environments with coverage for AWS, GCP, and Azure in the same platform. Increase insights into complex environments with the industry’s largest library of pre-built monitoring templates covering your entire technology stack.

Reduce risk at scale

LogicMonitor allows enterprises to rise above the limitations of legacy monitoring tools. AIOps features surface anomalies and deliver precise root cause analysis for service-impacting issues to rapidly surface actionable insights. By leveraging cutting-edge machine learning and embedded intelligence LogicMonitor separates the signal from the noise.

  • Visualize dependencies with dynamic topology mapping
  • Correlates anomalous logs and trending metrics to establish root cause
  • Ensure your teams only receive alerts for the issues that matter with dynamic thresholds tuned to your environment
  • Predict future trends and plan utilization with advanced forecasting

Drive growth and transformation

A strategic partnership with LogicMonitor breaks down silos and eliminates scaling obstacles to increase business agility – giving you back the time and resources you need to focus on innovation and delivering high-value services and offerings.

Tame tool sprawl

Shift from a siloed, tool-driven approach to a unified platform approach with insights that connect your services and applications to their underlying technology in a single unified view.

  • Consolidated role-based administration through a secure SaaS portal
  • Eliminate knowledge silos through unified data ingestion, dashboarding and intelligent alerting
  • Connect monitoring insight with incident, change, and configuration managment with built-in support for ServiceNow
LogicMonitor NOC Overview Dashboard
multi cloud overview dashboard showing GCP and AWS performance inside of LogicMonitor
LogicMonitor Tomcat Application dashboard
kubernetes pods performance monitoring dashboard
Header image for webinar

Our Trust Scores

Recognized for Excellence

TrustRadius best of 2023
G2 2023 Best Usability Enterprise
G2 2023 Best Results Enterprise
G2 2023 Momentum leader
lm-awards_PeerSpot-Leader

Rating from Gartner Peer Insights and Customer Satisfaction leader on G2

/

Rated “Excellent” and an “Editor’s Choice” by PCMag

Excellent

The highest NetPromoter score of any IT Infrastructure Management provider

Highest

Read LogicMonitor reviews on G2

We use LogicMonitor as our infrastructure monitoring platform across our 7 plants, 7 logistics facilities, 50 remote sites, and AWS/Azure hybrid cloud environments. LogicMonitor gives us a single pane of glass to view all of our infrastructures; from legacy hardware to bleeding-edge cloud resources

ZACK DIETZ INFRASTRUCTURE ENGINEERING MANAGER, REHRIG PACIFIC COMPANY

We have decommissioned a lot of tools since bringing LogicMonitor onboard. Datadog, Splunk, Pingdom, New Relic, a number of Prometheus, and Grafana environments. LogicMonitor has helped consolidate, standardize, and eliminate a lot of overhead and tool spread.

WILLIAM GUERTIN SENIOR SYSTEM ADMINISTRATOR, ACCRUENT